
Reading a flood claim at Conselice while the water was still on the ground
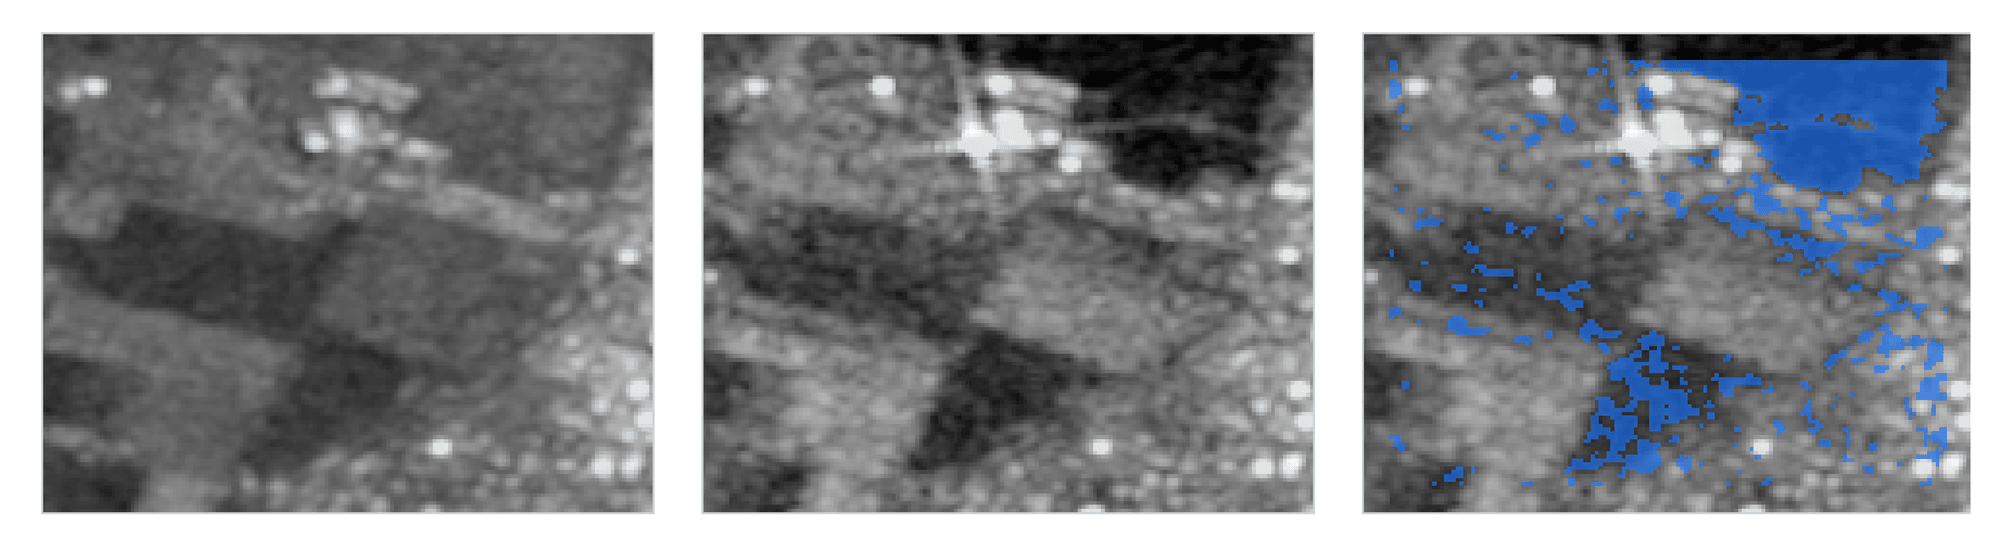
In May 2023 most of Emilia-Romagna sat under cloud for weeks. Radar passes two and three days after the loss read 23 of 114 hectares of a claim parcel newly flooded. The first clear optical scene, a month later, showed almost nothing.
- Parcel
- West of Conselice, Ravenna
- Date of loss
- 20 May 2023
- Radar after
- 22 and 23 May 2023
- Radar before
- 10 passes, Mar to May
- Newly flooded
- 23.2 ha, 20.4%
- First clear optical
- 17 June 2023
- Product
- Claims validation
- Paper
- Claims and portfolios, 2026
The problem
A claims desk needs a dated reading of a flooded parcel before it decides whether to send an adjuster, and in May 2023 cloud sat over most of the region for weeks.
What we did
The parcel's Sentinel-1 radar in the first days after the loss, compared with ten passes from the two months before, with permanent water taken out.
The result
23.2 of 113.6 hectares read newly flooded within three days of the loss. The first clear optical scene came a month later, when the water could no longer be seen.
Overview
On 16 and 17 May 2023 a second wave of rain in a fortnight fell on Emilia-Romagna, and rivers that had already burst their banks earlier in the month went over again. The Sillaro embankment gave way near Conselice in the Province of Ravenna, and the plain around the town filled.
This case reads one agricultural parcel just west of the town, inside the flooded plain, as a claims desk would receive it: a boundary, a date of loss of 20 May, and a question about what happened on that ground. It is one of our own test cases, not a customer's claim.
The challenge
A claims desk deciding whether to send an adjuster wants to know what the ground did, when, and on which evidence. For a flood the window is short. Water drains, crops close over what is left, and within weeks the field looks ordinary from above.
Cloud is the usual obstacle. A flood arrives with the weather that caused it, and in May 2023 most of the region sat under cloud for weeks. An optical record that waits for a clear day can miss the event entirely.
What we did
The parcel was read with Copernicus Sentinel-1 radar, which sees through cloud. Ten passes between 23 March and 11 May 2023 set the parcel's own reference before the loss. Two passes on 22 and 23 May, two and three days after the date of loss, were compared with that reference.
Ground that turned newly wet between the two was mapped and counted in hectares. Permanent water from the JRC Global Surface Water record was taken out first, so a canal or a pond is never counted as flood. The same parcel was then read on the first clear Sentinel-2 optical scene after the loss.
What the record showed
| Parcel readable area | about 113.6 ha |
| Newly flooded, radar, 22 to 23 May | 23.2 ha |
| Share of the parcel | 20.4 per cent |
| Radar passes before the loss | 10, from 23 March to 11 May 2023 |
| First clear optical scene | 17 June 2023 |
| Newly flooded on that scene | 0.08 per cent |
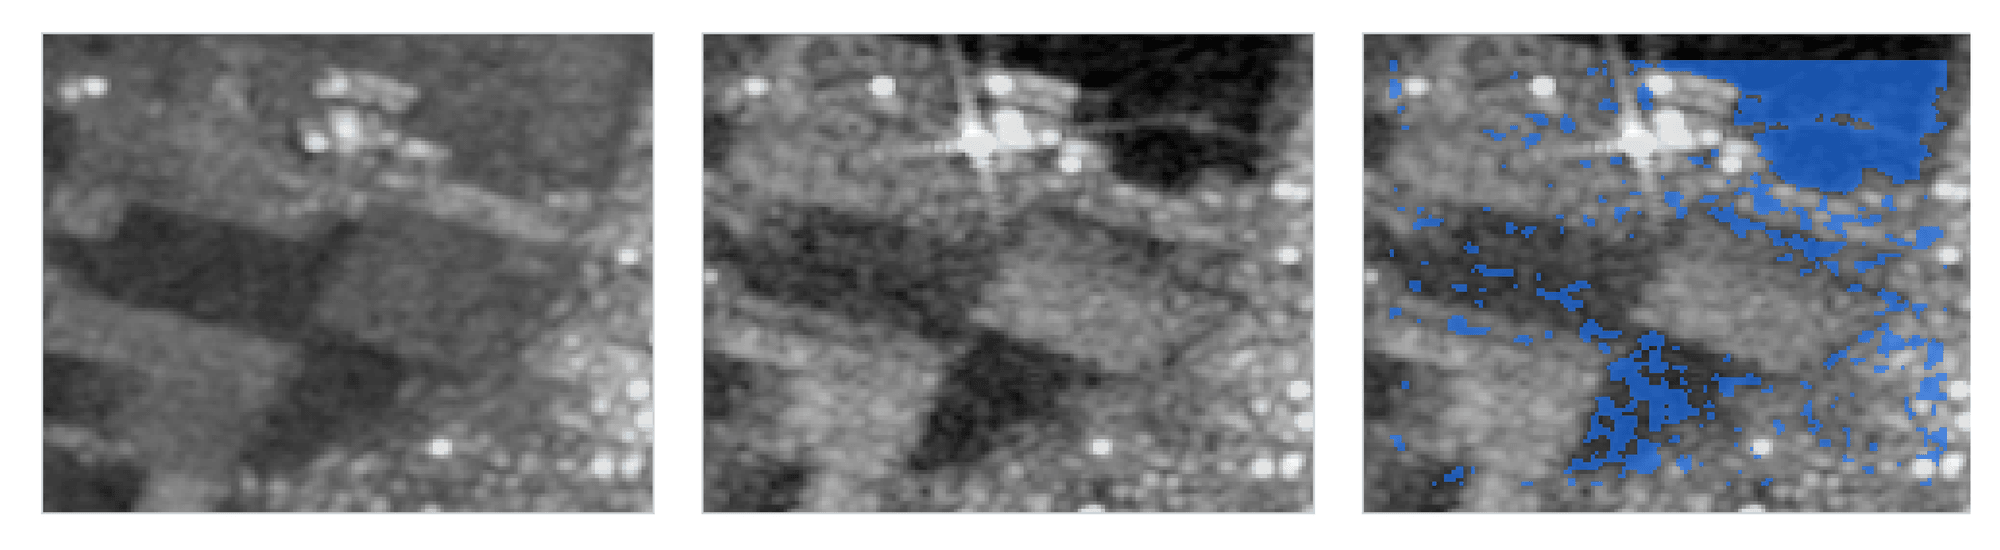
The radar reads 23.2 hectares of the parcel newly flooded, a fifth of it, within three days of the loss. The flooded ground sits in the north-east corner of the parcel and in a band across its southern half.
The first clear optical scene came on 17 June, nearly a month later. By then the crop canopy had closed over what water remained, and the optical reading shows almost nothing. Both readings are in the record, each with its date.
What it means
For a claims desk the useful reading is the one taken while the water can still be seen. Radar puts that reading inside the window, and the record names every pass by date so an adjuster can open the same scenes.
The record says what the ground showed and when. It does not settle the claim; the desk does. What it removes is the question of whether anything happened on the parcel at all, which is the question that otherwise sends an adjuster out to look at a field that has already dried.
The same reading runs on a book of claims. Ten closed claims from last season, re-read against what the adjusters found, is the quickest way to see where it fits a desk's own process.
Run this on your own ground
Draw an area of interest, pick the dates, and the same analysis runs against the archive over your sites.
References
- Axine Labs (2026). Dated records for claims and portfolios. Three live runs, section 1.
- European Space Agency. Copernicus Sentinel-1 mission. sentinels.copernicus.eu
- Pekel J.-F., Cottam A., Gorelick N., Belward A. S. (2016). High-resolution mapping of global surface water and its long-term changes. Nature 540, 418 to 422. doi.org/10.1038/nature20584
- UN-SPIDER. Recommended practice: flood mapping and damage assessment using Sentinel-1 SAR data. un-spider.org
More case studies
Storm Johannes: which stands to visit first, ranked from open imagery
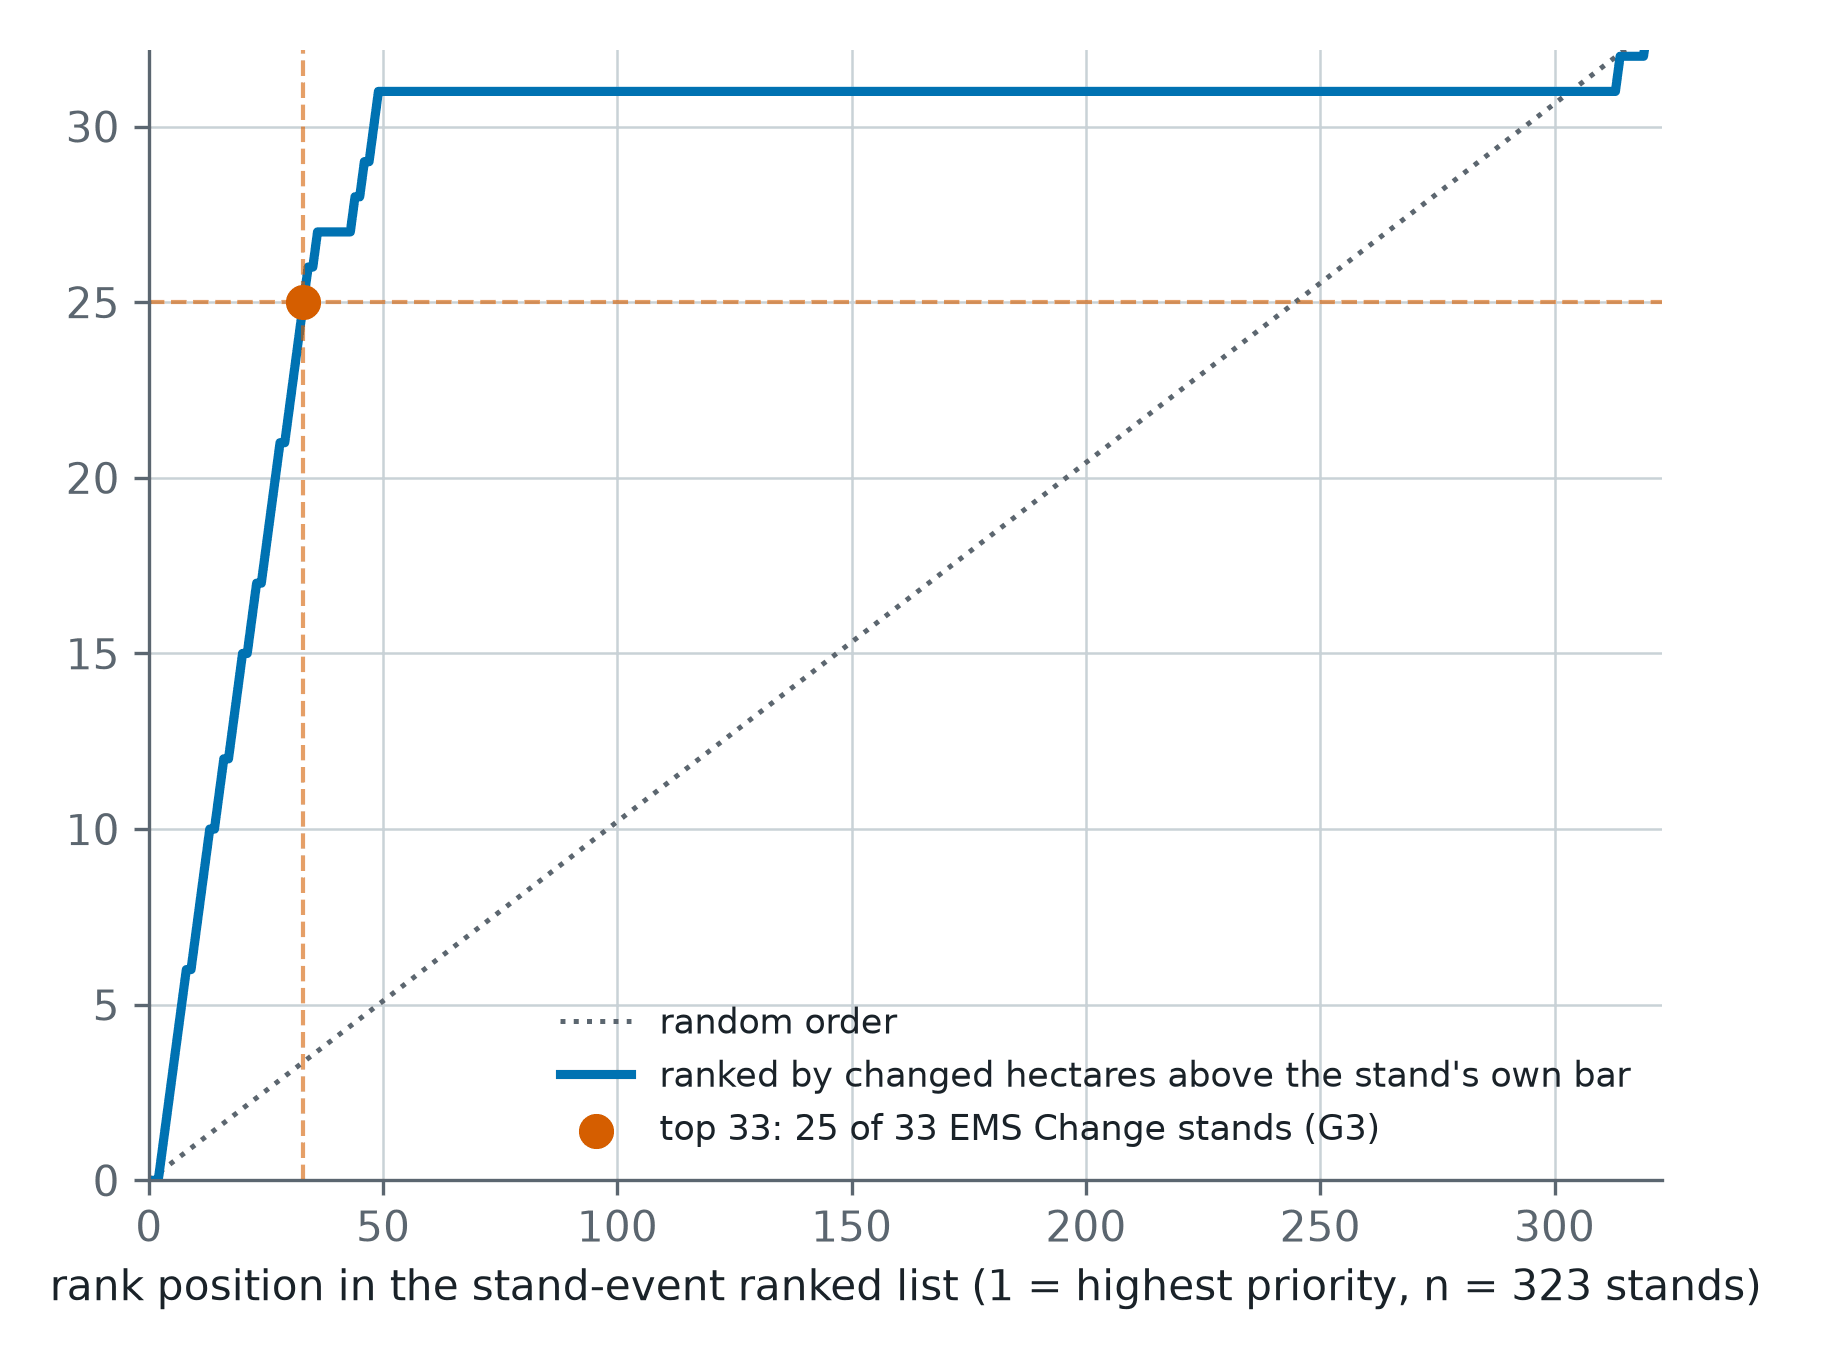
After the December 2025 storm in central Sweden, 323 test stands were ranked from Sentinel-1 and Sentinel-2. Of the 33 the storm had changed, 25 sat in the top 33 of the list. Random order would have put three or four there.
Forty-three seasons of one Nebraska pivot, and its first zone map
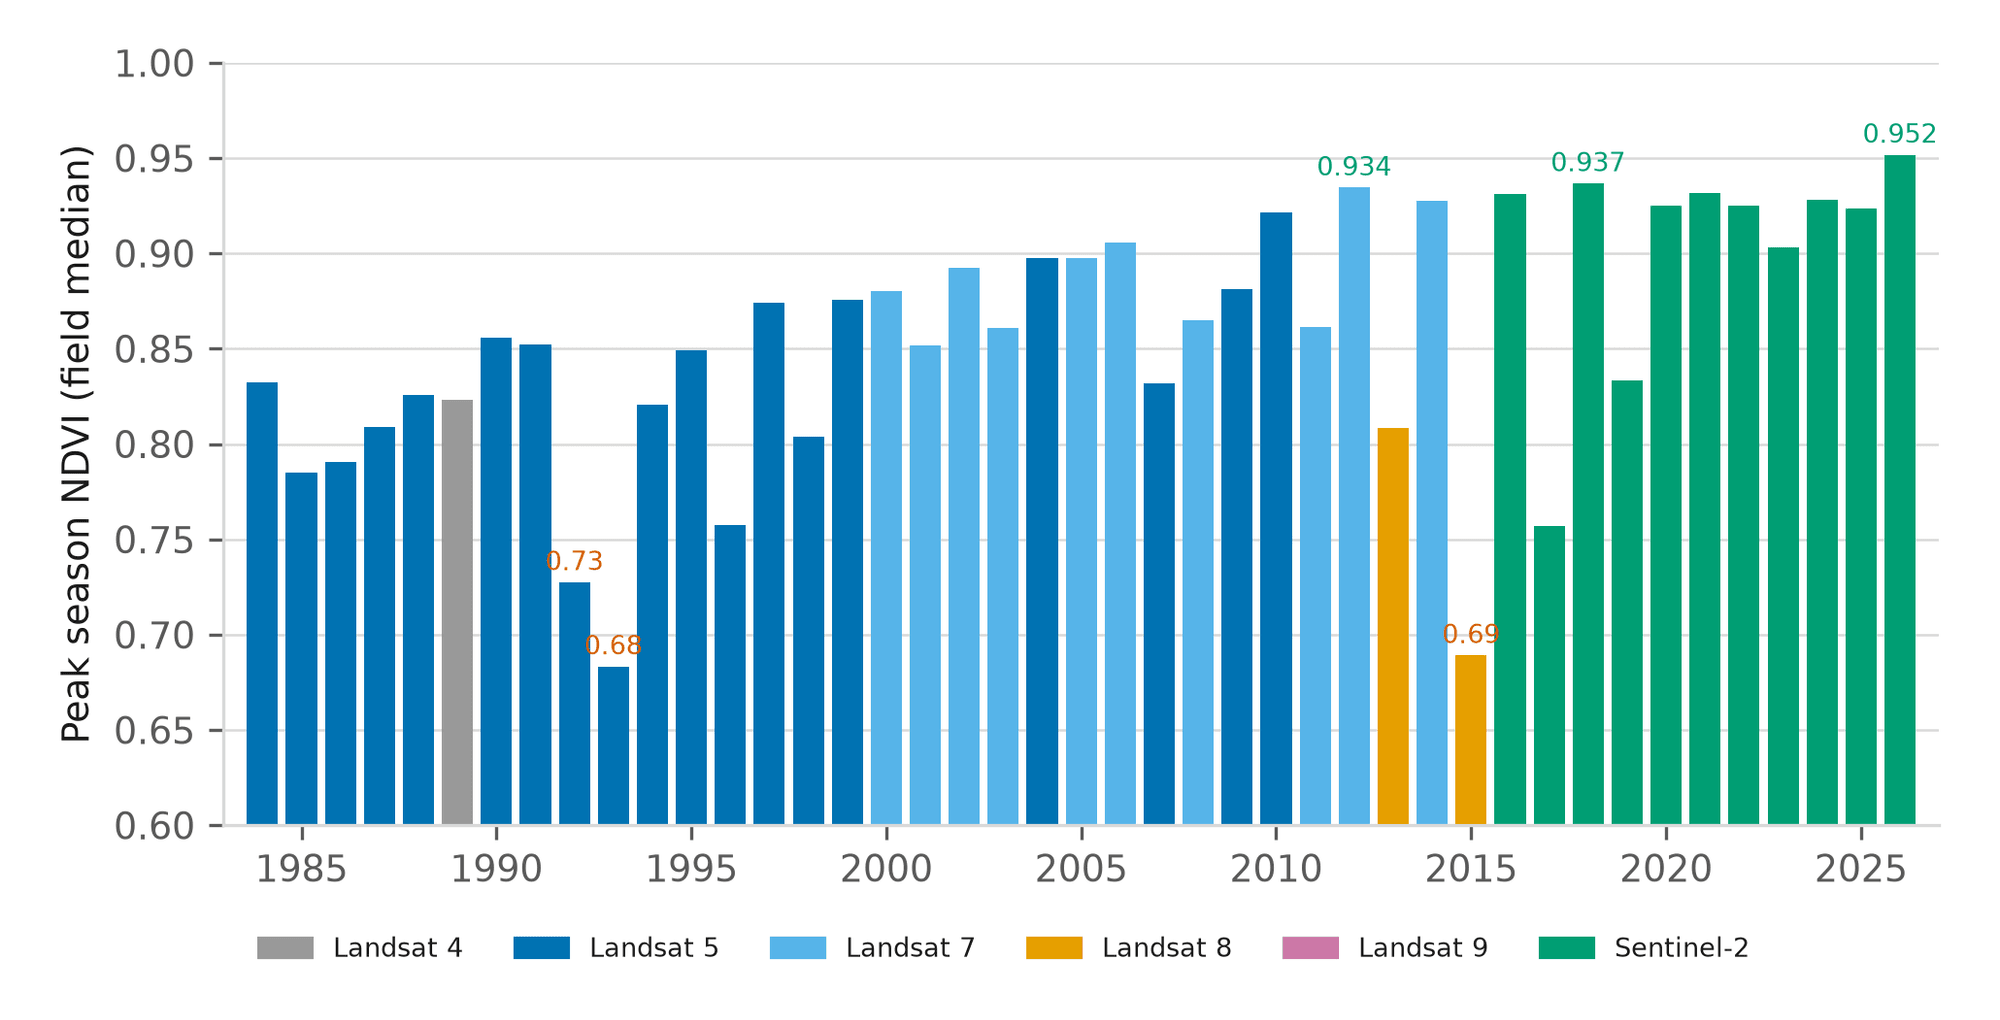
Before driving out, an agronomist wants to know whether this season is unusual for this field, not for the county. One centre pivot near Seward has a reading for every season from 1984 to 2026, and 2026 is the highest of them.
A Kansas season on one page, and the next two weeks of disease pressure
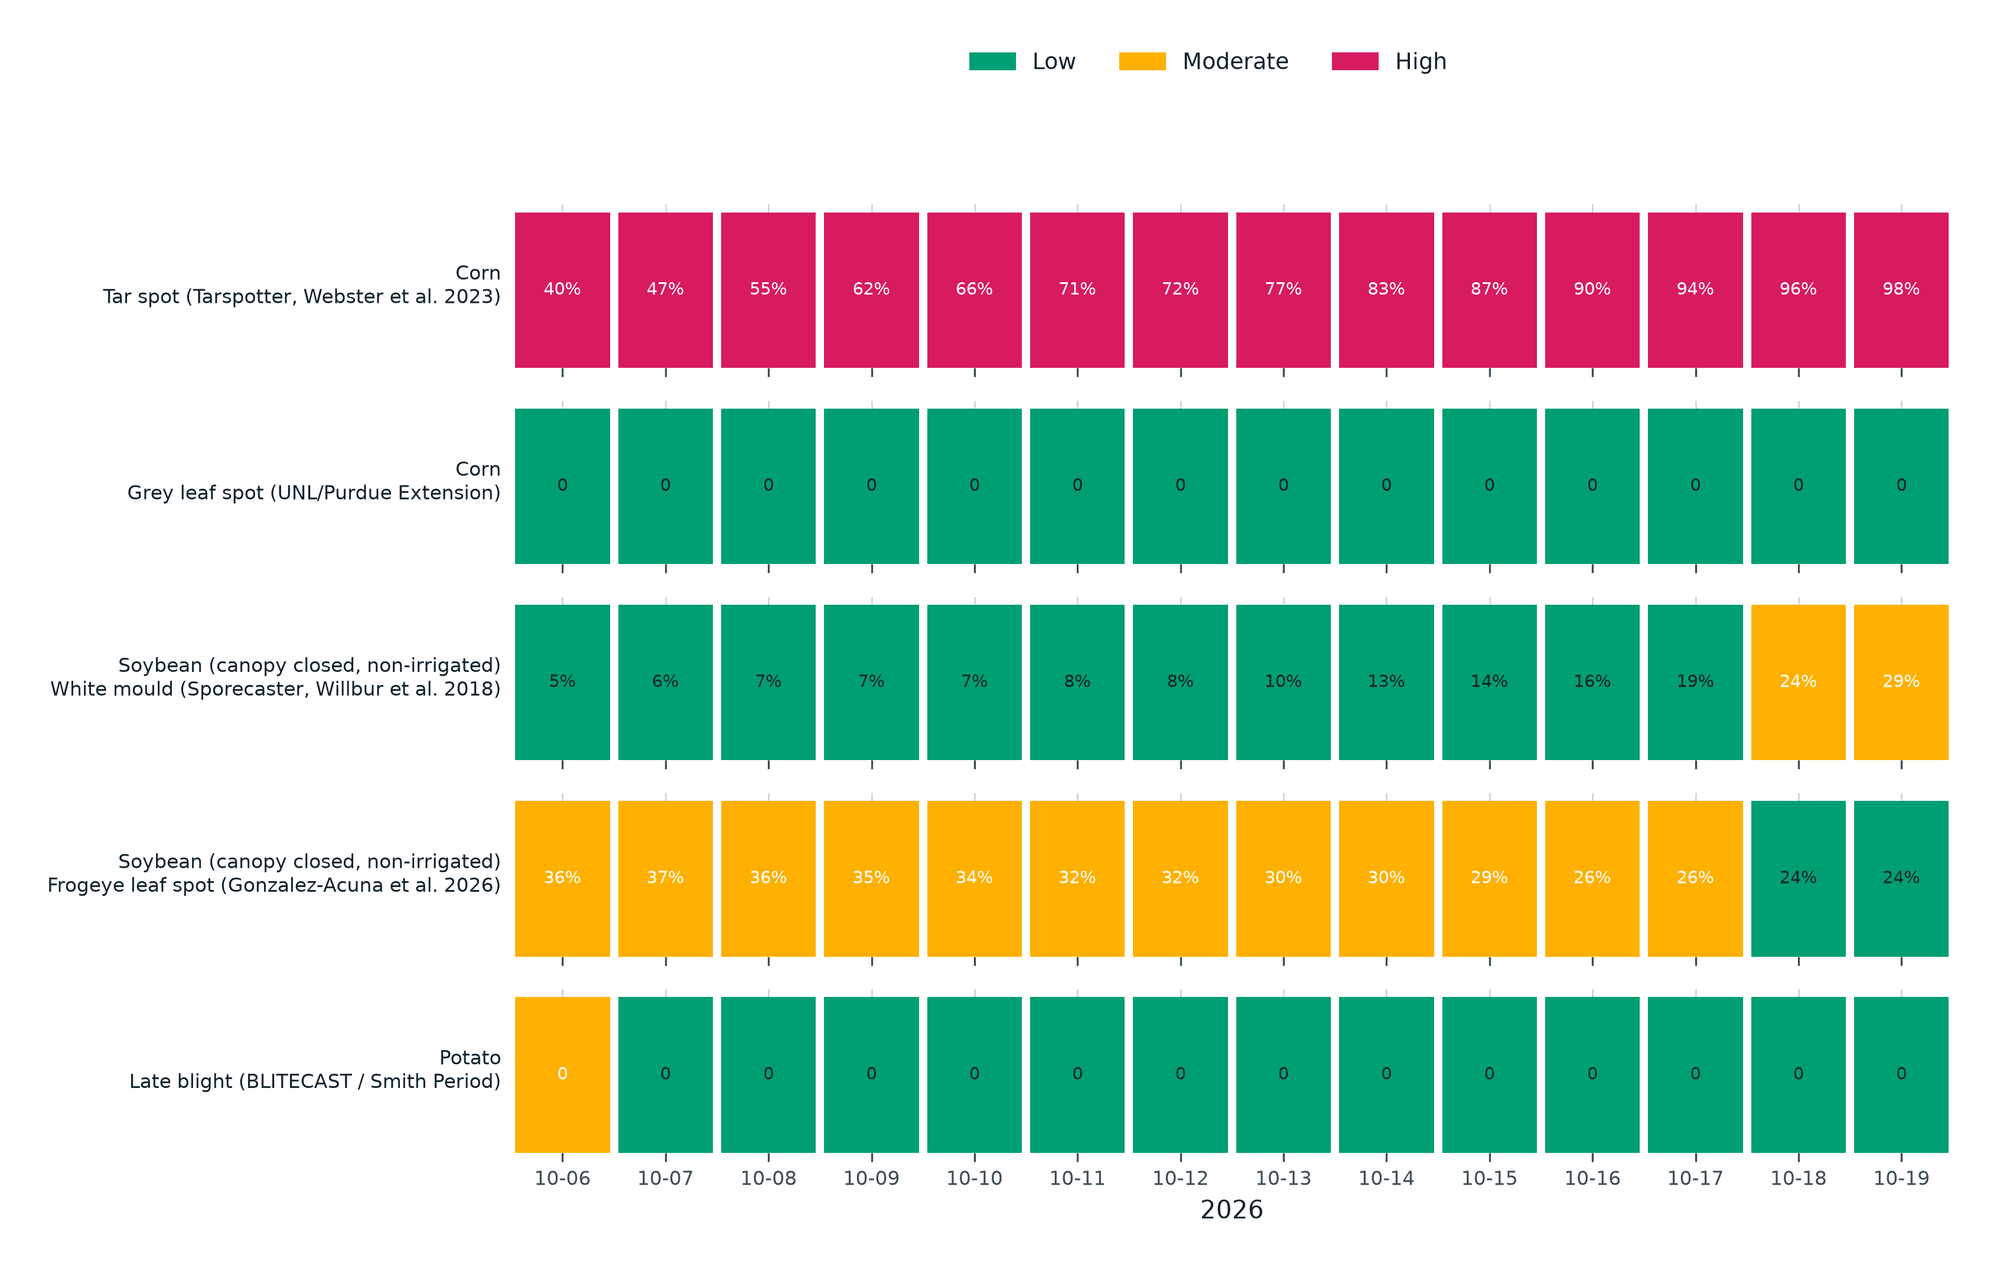
A 61-hectare corn pivot in western Kansas, 184 days into the 2026 season: 53 days at or above 35 °C against a normal of 27.8, more heat units than usual, and five published disease models run on the field's own forecast.