
Topsoil Clay & Salinity Index
Topsoil clay absorption depth and gypsum hydration, measured on bare, dry soil.
Gypsum and clay readings on bare soil. Salt itself is invisible to the sensor, so salinity is only ever inferred from what travels with it.
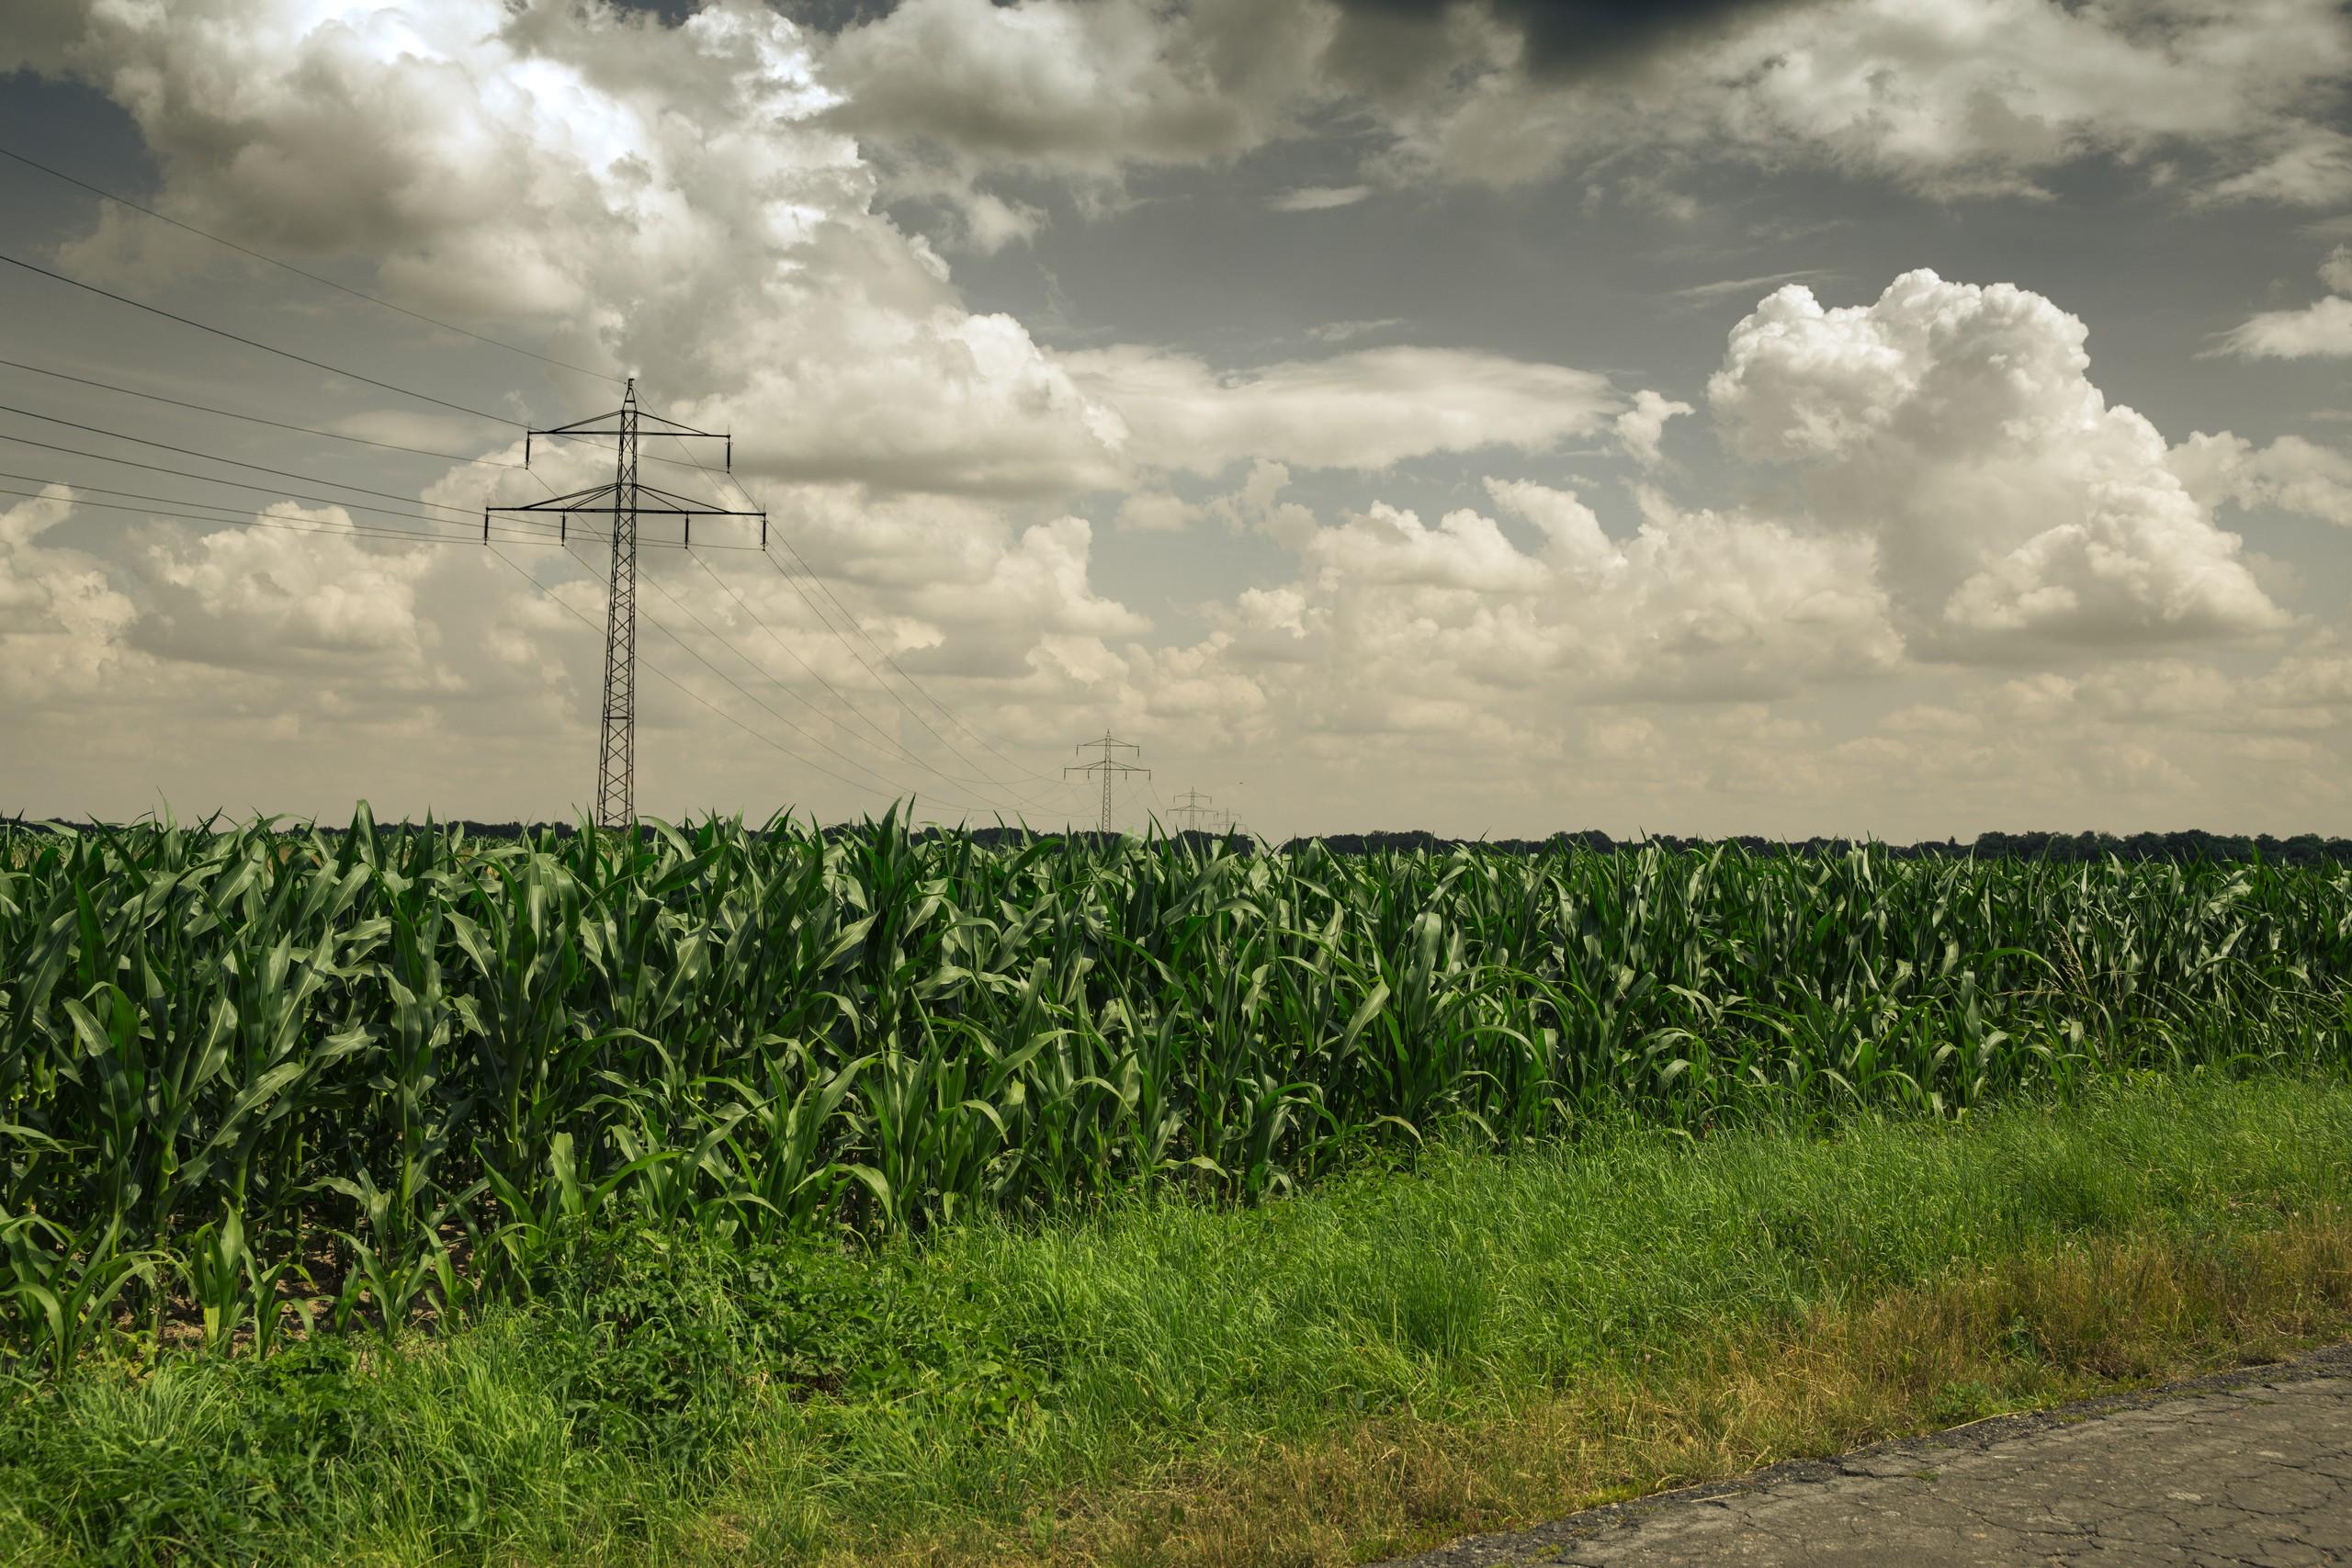
Bare topsoil: clay absorption depth alongside the gypsum hydration reading.
WHAT THE SENSOR SEES
What this layer looks for.
The laboratory reference for each material, and what the sensor's band spacing captures of it. The shaded band marks the range the method reads.
WHAT IT FINDS
What it detects.
| Material | Typical setting | What can confuse it |
|---|---|---|
| Gypsum & Sodic Salinity Crusts | Irrigated basins, dryland salinity discharge areas, and playas | Wet soil suppresses the gypsum absorption; halite itself is spectrally silent |
| Topsoil clay absorption depth | Agricultural seedbeds and arable topsoils | Organic matter flattens the clay feature and shallow depths are the common case |
METHOD
How it works.
Calibrated reflectance goes in, and every pixel is fitted against a public reference library.
Bare soil extraction
Dry exposed soil pixels are selected from the archive's surface reflectance product; anything under crop or residue is excluded rather than corrected.
Gypsum hydration depth
Gypsum hydration is measured on fixed shoulders. Which features are available depends on what the sensor covers, and the ones out of reach are simply not used.
Clay absorption depth
Clay absorption depth is reported directly. It deepens with clay content, and turning it into a texture class is a regional calibration rather than a direct reading.
Layers reported side by side
Gypsum and clay depths are delivered as separate layers with their evaluable fractions. No electrical conductivity proxy is derived from them.
SPECIFICATIONS
What you get, and what it runs on.
Conditions it needs
Method and checks are documented in Axine Applied Spectroscopy Paper #5 · Section 5.1.
Scope
Salt itself is invisible to the sensor, so salinity is inferred from the minerals that travel with it.
RUN IT OVER YOUR GROUND
Run this layer over your own area.
Order processing over your area of interest, or a tasked capture where the archive has nothing usable. Imagery access is never charged for: a plan buys the models.
COMPLEMENTARY ANALYTICS
Related layers.
Soil Exposure & Crop Residue
Crop residue cover and topsoil clay, for residue and tillage classes.
Soil Organic Carbon Proxy
Each pixel is composited to the moment it was most exposed, then ranked for organic matter. No carbon content is reported.
Surface Water Quality
Screening for pigment and turbidity over inland water, using published fits applied unchanged.