
Microexsudação de Hidrocarbonetos
Redbeds descorados e carbonato secundário acima de bacias petrolíferas, reportados como indicadores e não como uma detecção.
Padrões de alteração de superfície acima de bacias petrolíferas, reportados como indicadores e não como uma descoberta.
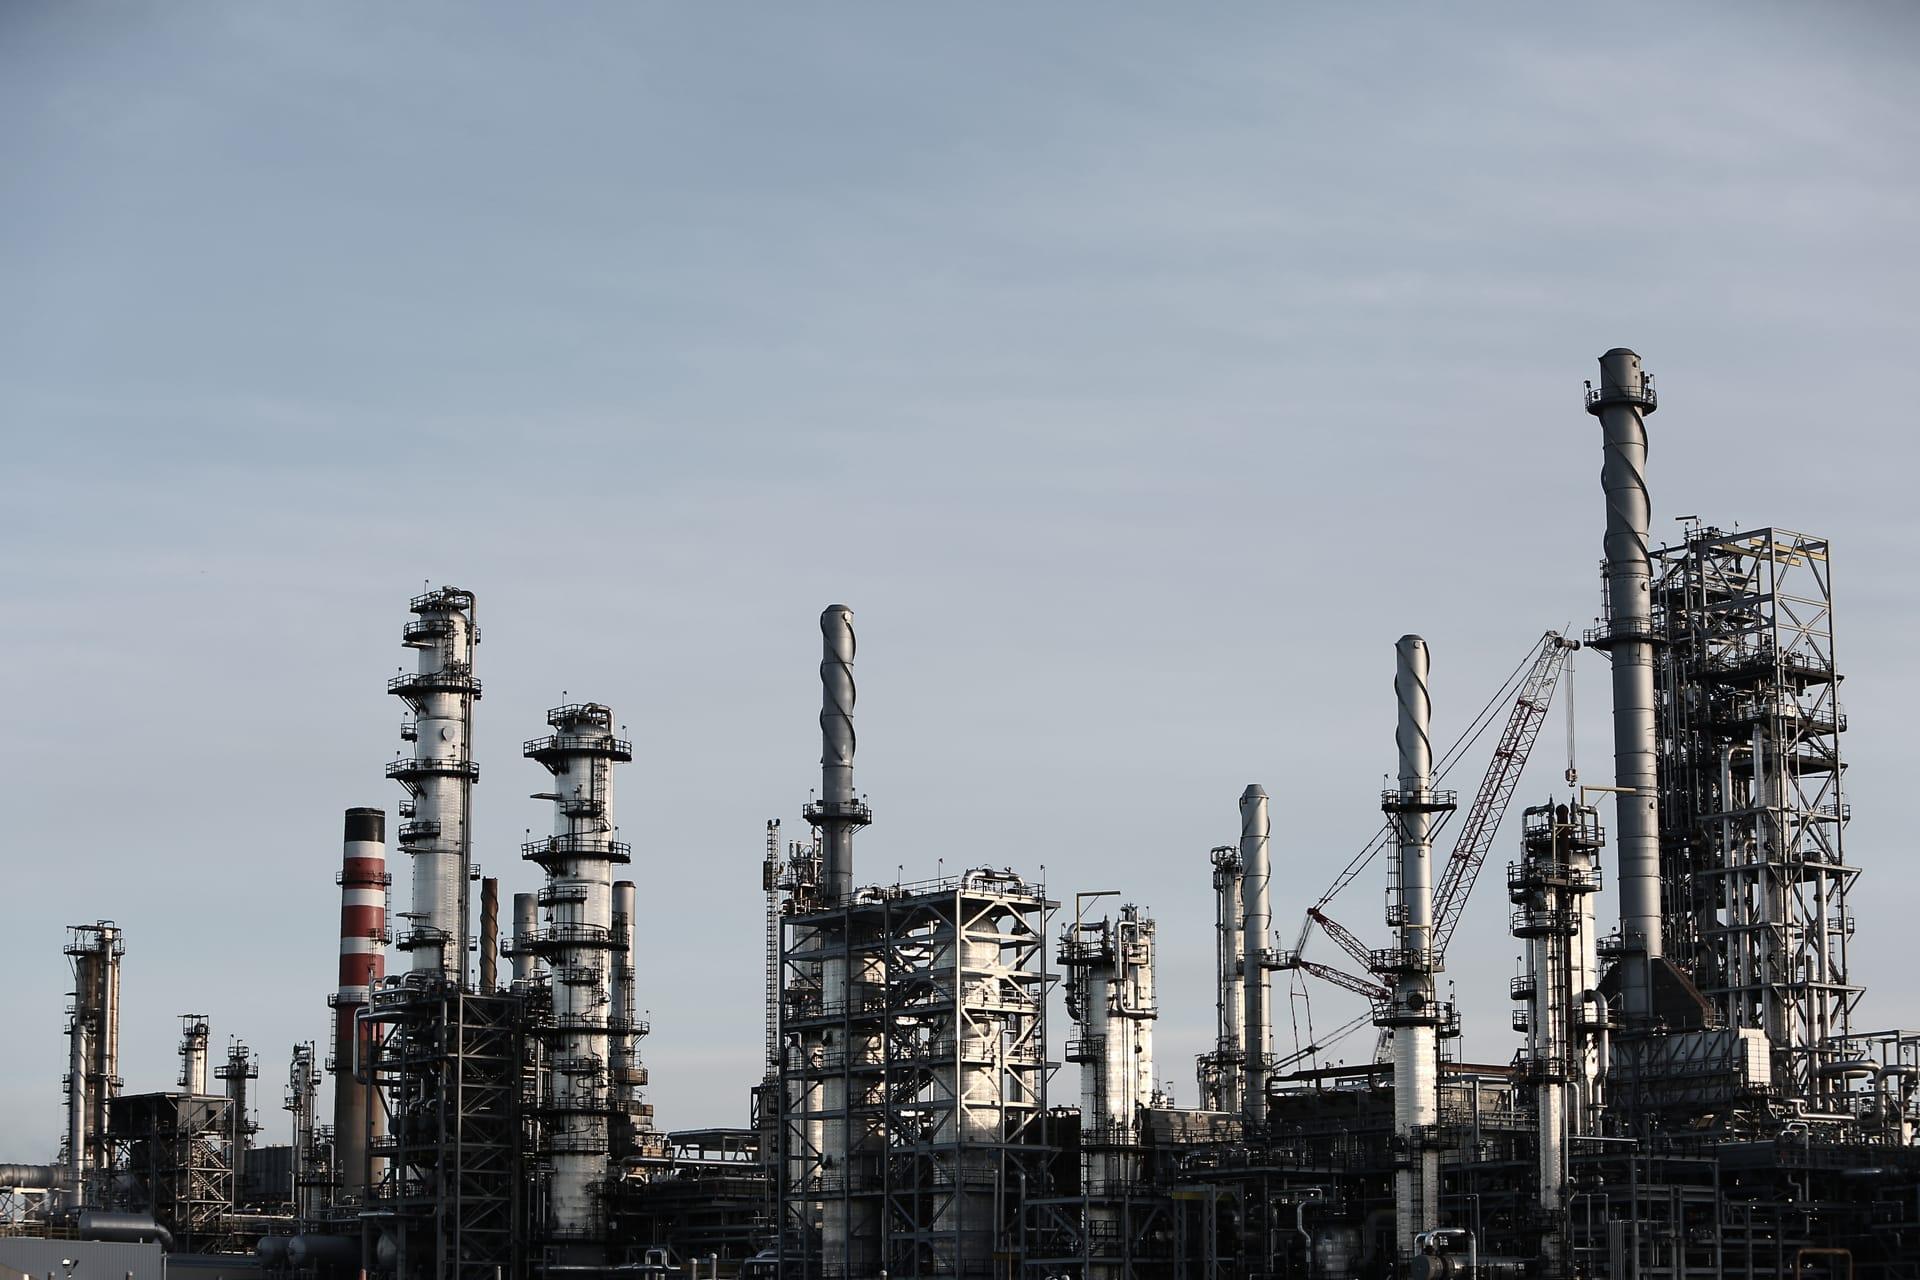
Bleached redbed and epigenetic carbonate patterns of the kind associated with hydrocarbon microseepage.
O QUE O SENSOR VÊ
O que esta camada procura.
A referência de laboratório de cada material, e o que o espaçamento de bandas do sensor captura dela. A faixa sombreada marca o intervalo que o método lê.
O QUE ELA ENCONTRA
O que ela detecta.
| Material | Contexto típico | O que pode confundi-la |
|---|---|---|
| Epigenetic Bleaching & Carbonate Minerals | Sedimentary basins over oil and gas reservoir traps | Agricultural lime spreading and modern sedimentary evaporites |
MÉTODO
Como funciona.
Entra reflectância calibrada, e cada pixel é ajustado contra uma biblioteca pública de referência.
Ferric depletion mapping
Measures iron absorption depth across a stratigraphic unit, so bleaching shows as a deficit against that unit's own background rather than against an absolute number.
Epigenetic carbonate extraction
Picks out localised secondary carbonate inside the bleached ground.
Drainage and modern-soil filtering
Alluvial channels and recent soils are removed using elevation-derived drainage, since both produce the same two signals for entirely mundane reasons.
Co-occurrence, not a score
The two layers are shown together, and where they coincide. They stay separate rather than being folded into one score, because two independent indicators are more useful read side by side.
ESPECIFICAÇÕES
O que você recebe, e sobre o que ela roda.
Condições de que precisa
Method and checks are documented in Axine Applied Spectroscopy Paper #2 · Section 5.2.
Escopo
An indicator layer only. The same surface patterns occur without hydrocarbons beneath them.
EXECUTE SOBRE O SEU TERRENO
Execute esta camada sobre a sua própria área.
Solicite processamento sobre a sua área de interesse, ou uma captura programada onde o acervo não tiver nada utilizável. O acesso às imagens de satélite nunca é cobrado: um plano compra os modelos.
ANALÍTICAS COMPLEMENTARES
Camadas relacionadas.
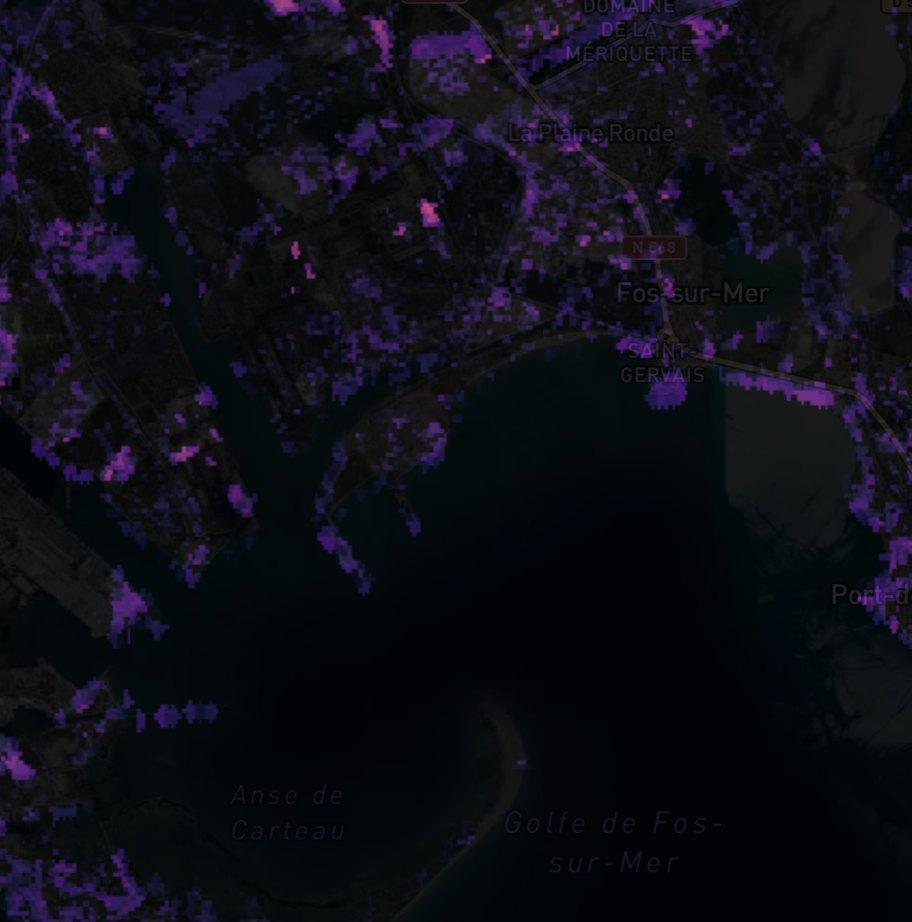
Detecção de Plumas de Metano
Realce de coluna sobre instalações de óleo e gás. Produtos públicos de plumas revisados passam adiante com sua proveniência, e nosso próprio filtro roda em paralelo como triagem.
Mapeamento de Capas Geotérmicas
Encontra capas de reservatórios ativos e fósseis por meio de minerais de amônio, alunita e sínter silicoso.
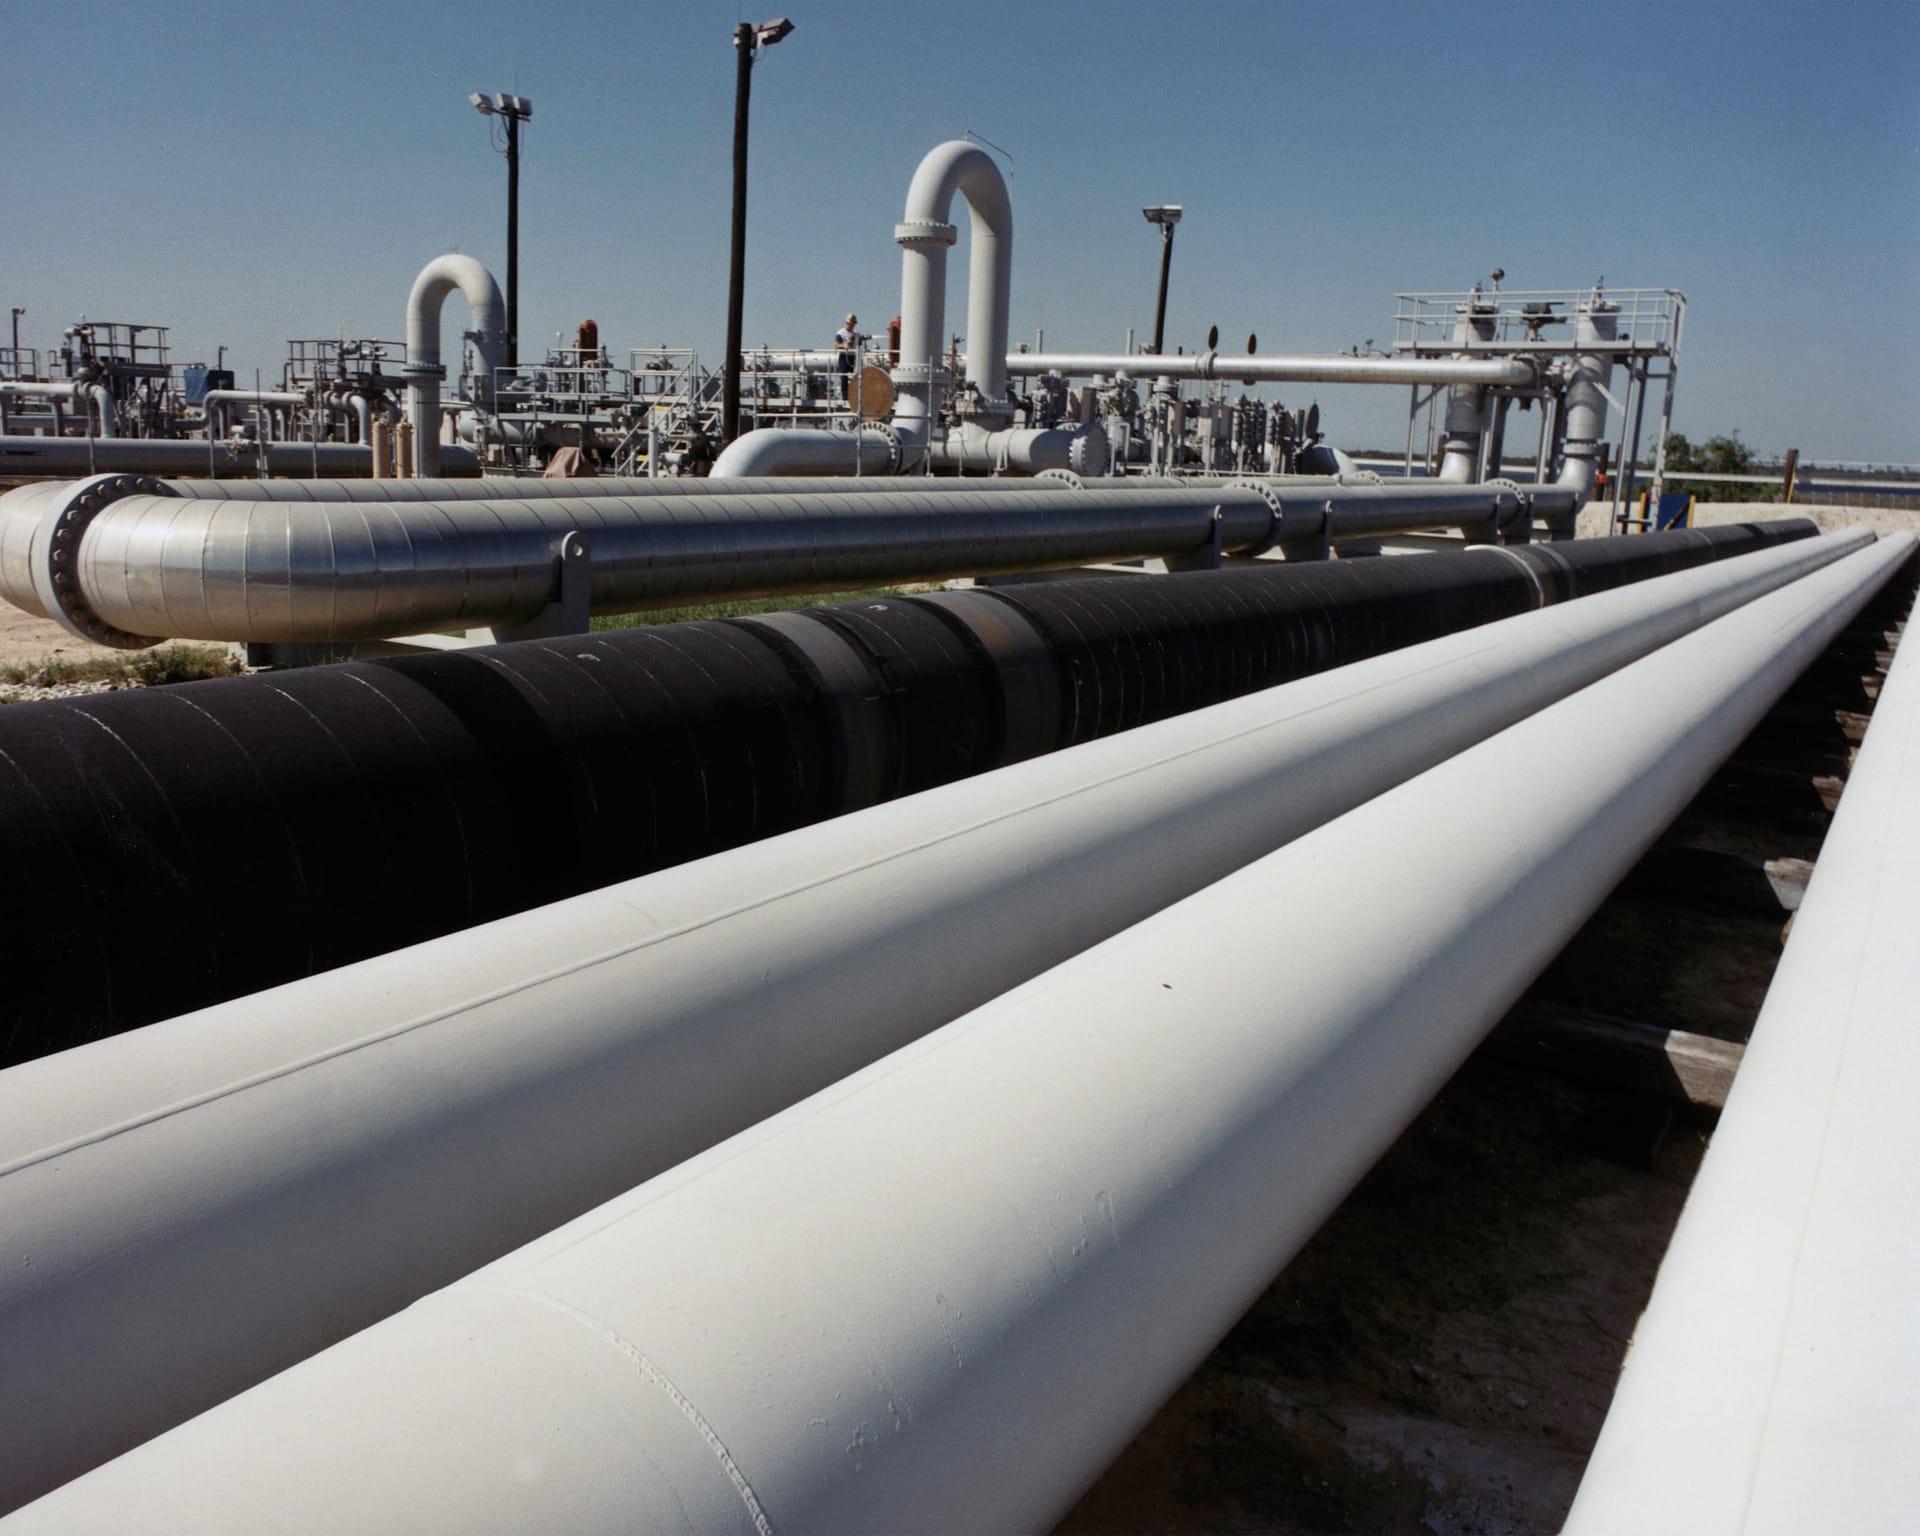
Estabilidade do Terreno em Corredores de Dutos
Acompanha argilas expansivas e umidade ao longo de um corredor, para que as equipes vão aonde o terreno realmente se moveu.