
A dated record for every claim and asset
Before an adjuster drives out, the record shows what moved on the parcel, by how much, and on which dated scenes. The same reading runs across a book of assets, each against its own history, so the visits go where something changed.
01 · Who it is for
The people who file, settle and advise
Claims teams
Claims managers and loss adjusters at regional and mutual insurers settling flood, fire and storm losses.
Underwriters and risk managers
Teams reviewing a book of property, farmland or forest who need hazard and change for every asset.
Lenders
Agricultural lenders, farmland funds and construction lenders checking the ground behind a loan.
Parametric programmes
Programmes and reinsurers that need a dated event layer, with its scenes and sources, to settle on.
Cloud over floods
Optical imagery rarely sees a flood while the water is still standing. Radar does, so the flood record leads with Sentinel-1 and reads within days of the loss.
Reporting cycles
Solvency and climate-risk reporting asks for hazard per asset. Each class in the scan names the public dataset it came from.
Rural credit
Brazil’s CMN Resolution 5.267/2025 requires satellite monitoring of every financed rural area for the life of the loan, with records that can be audited.
02 · Products
What you can order
Each product is ordered over your own plots, fields, stands or assets, and comes back as a document and a set of map layers.
Claims validation
A dated before and after record of a claim parcel, read from the scenes on either side of the date of loss.
Asset status check
Each asset in a book read against its own previous three years, with the ones that changed beyond their usual range marked.
Construction progress
A monthly built share for a construction site, with a dated satellite image beside every month.
Flood extent and risk
Where water stood after a flood, read from radar, which parcels sat in it, and a terrain exposure class for the ground.
Damage mapping
A before and after read of one area after one event: changed ground, built-up damage candidates, and screens over water.
Climate risk scan
Seven hazard classes for every asset in a book, from long weather records and public hazard archives.
Portfolio monitoring
One view of a registered book: the latest flood, fire, forest and site records for each asset, with changed assets first.
Storm stand record
After a storm, a dated record of every stand, ranked by where to send a drone or a forester first.
Forest cover change
Forest cover at a start date, and the loss and gain between two dates, with the Landsat trajectory behind it.
Burnt area and damage degree
The burnt extent of a fire and its damage degree in five classes, with hectares and shares, for owners and claims desks.
Crop classification
What crop stood on an area in a season, as a map and as parcels, with your own field truth taking precedence where you have it.
Land cover classification
An area classified into ESA WorldCover classes for a chosen season, and what changed between two periods.
Field boundaries
Candidate field outlines over an area for one closed season, each with a confidence by field size, for review.
Yield prediction
A per-field yield estimate with an 80 percent interval, and the back-test of the county model behind it printed beside it.
Soil moisture
Whether the soil is wetter or drier than normal right now, at the surface and at root depth, against the field’s own history.
03 · What comes back
A document you can forward, and the layers behind it
- 01A dated before and after record for each claim parcel, with every scene listed
- 02Event layers for flood extent, burnt area and changed ground, in GeoTIFF, GeoJSON, KML and shapefile
- 03A status for each asset against its own history: within its quiet range, or above it
- 04A monthly built share for a construction site, with an image beside each month
- 05Seven hazard classes for each asset, from public climate and hazard records
- 06A portfolio view with one row per asset, and a PDF for the committee
04 · The record behind it
Measured on control sets, counted plot by plot
Every figure below is printed with its denominator in a dated paper. Each one links to the document it comes from.
- 23 ha
- of a 114 ha claim parcel at Conselice read newly flooded by radar, two to three days after the May 2023 floods
- 17 of 18
- months read at a construction site in Grünheide, Brandenburg, with 44 percent of the site read as built by June 2022
- 3 of 3
- assets in an Italian test portfolio read within their own quiet range, with the same figures on a repeat read
05 · Case studies
Read on real ground
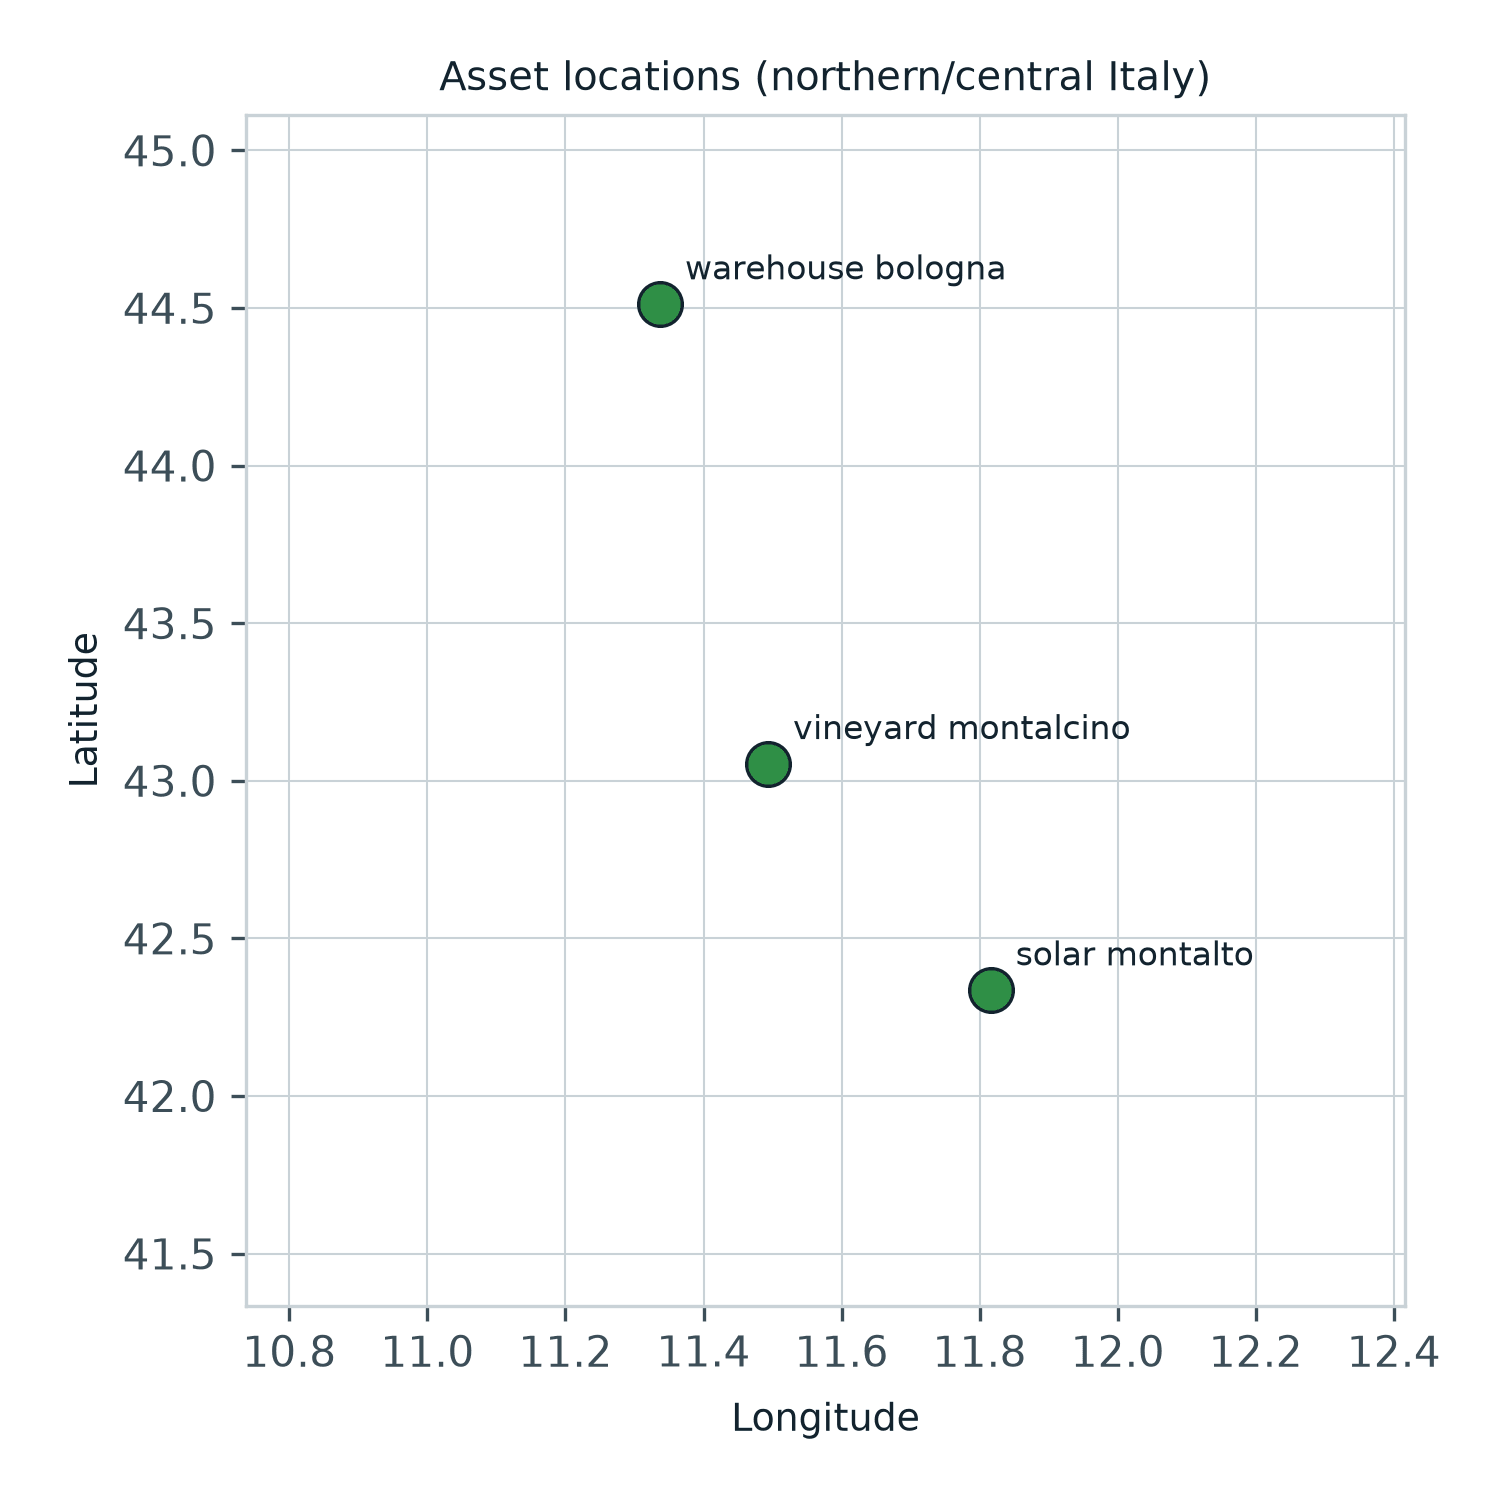
Three Italian assets, each read against its own history
A warehouse changes almost never, a vineyard changes every season. Read against their own previous three years, a warehouse, a solar farm and a vineyard all sat within their usual range, and a second read returned the same figures.
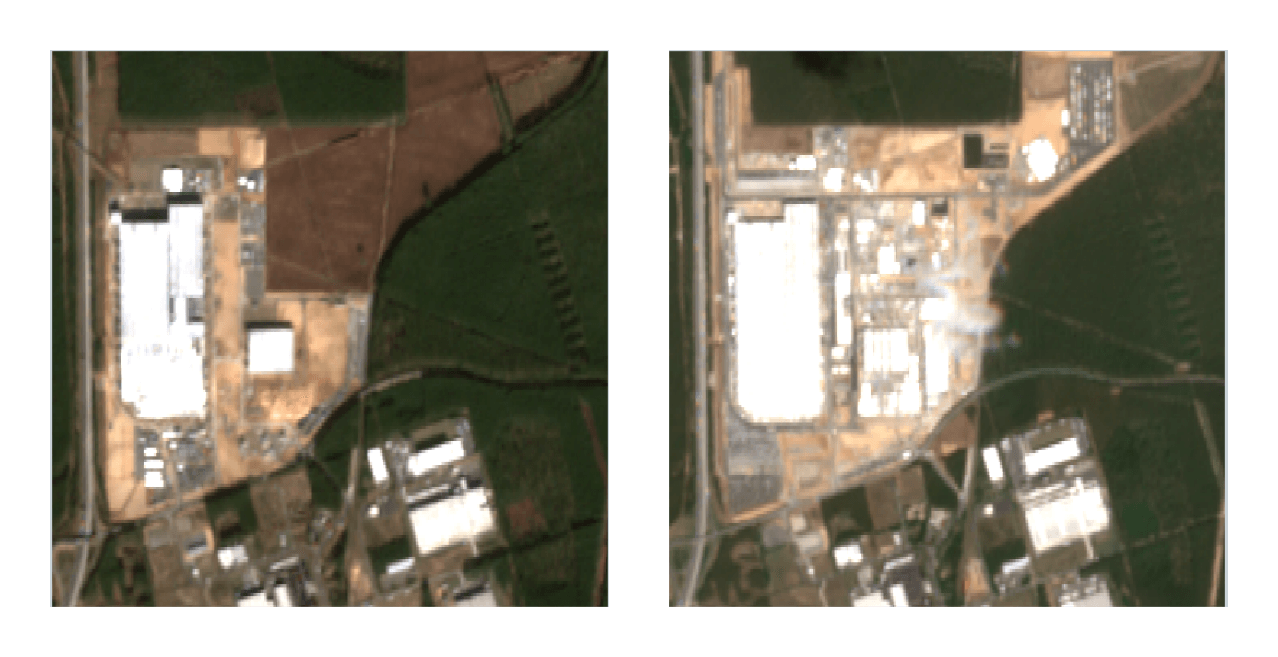
A monthly built record of a factory site in Grünheide, from open imagery
A lender financing a build wants to see how far a site has moved between draw requests. Seventeen of eighteen months at a large factory site in Brandenburg read clear, with 44 per cent of the site read as built by June 2022.
Reading a flood claim at Conselice while the water was still on the ground
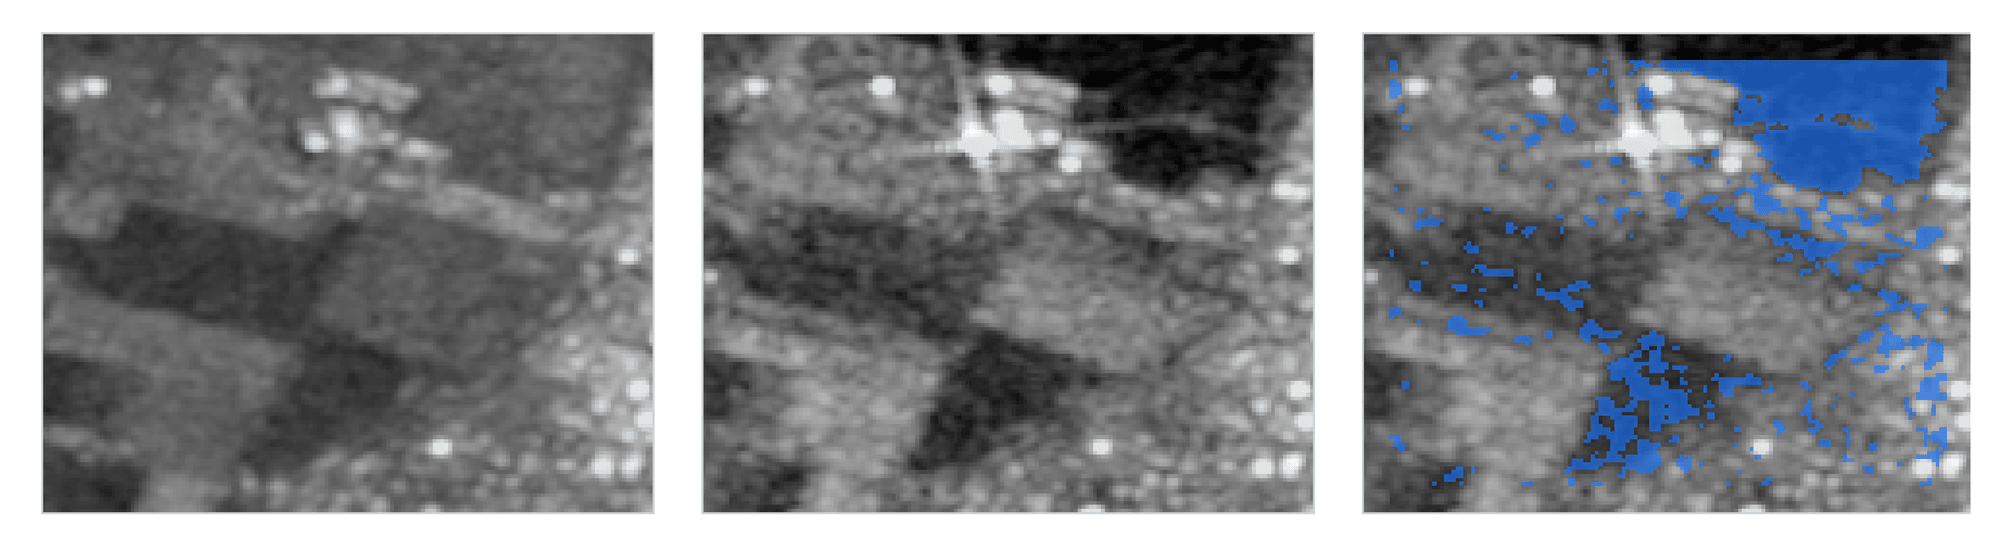
In May 2023 most of Emilia-Romagna sat under cloud for weeks. Radar passes two and three days after the loss read 23 of 114 hectares of a claim parcel newly flooded. The first clear optical scene, a month later, showed almost nothing.
Send us ten closed claims
Send ten claims from last season that are already settled. We re-read them at no charge, so you can set the record beside what your adjusters found.