
Por qué este método
La medición remota tiene un problema de credibilidad que se ganó. La historia del campo está llena de mapas que parecían seguros y significaban poco, de índices renombrados como hallazgos y de cifras de precisión citadas lejos del terreno donde se midieron. Cualquiera que haya pagado por uno de esos mapas carga con ese escepticismo en cada conversación posterior. Construimos para ese lector.
Nuestra respuesta es un método y no una promesa. Ajustar la física contra estándares de referencia públicos para que cualquiera pueda verificar la cadena. Rechazar los píxeles que no pueden medirse en lugar de promediarlos. Publicar qué significa una puntuación y qué no. Nada de esto es ciencia novedosa; es disciplina de laboratorio llevada a la órbita, y precisamente por eso funciona.
La honestidad aquí no es una virtud que publicitamos, es el único enfoque que sobrevive al contacto con un comprador técnico. Un geólogo, un ingeniero de reservorios o un silvicultor pondrá a prueba una capa contra terreno que ya conoce. Un método que admite sus límites pasa esa prueba y se gana el siguiente trabajo. Un método que promete de más la falla una vez, y de forma permanente.
Los principios
Siete reglas, aplicadas en el código, para cada capa que produce la plataforma.
La procedencia viaja con el resultado
Cada capa registra la escena de la que proviene, la hora de adquisición, la hora de procesamiento y la versión del modelo que se ejecutó. El registro se envía con la exportación. Un mapa abierto dentro de seis meses todavía se rastrea hasta sus insumos.
Estándares de referencia públicos
Cada producto ajustado se compara contra estándares de referencia de laboratorio publicados y no contra un conjunto de entrenamiento propietario. La física es pública, y la cadena de la medición a la respuesta puede verificarla cualquiera que quiera hacerlo.
El terreno enmascarado se cuenta, no se adivina
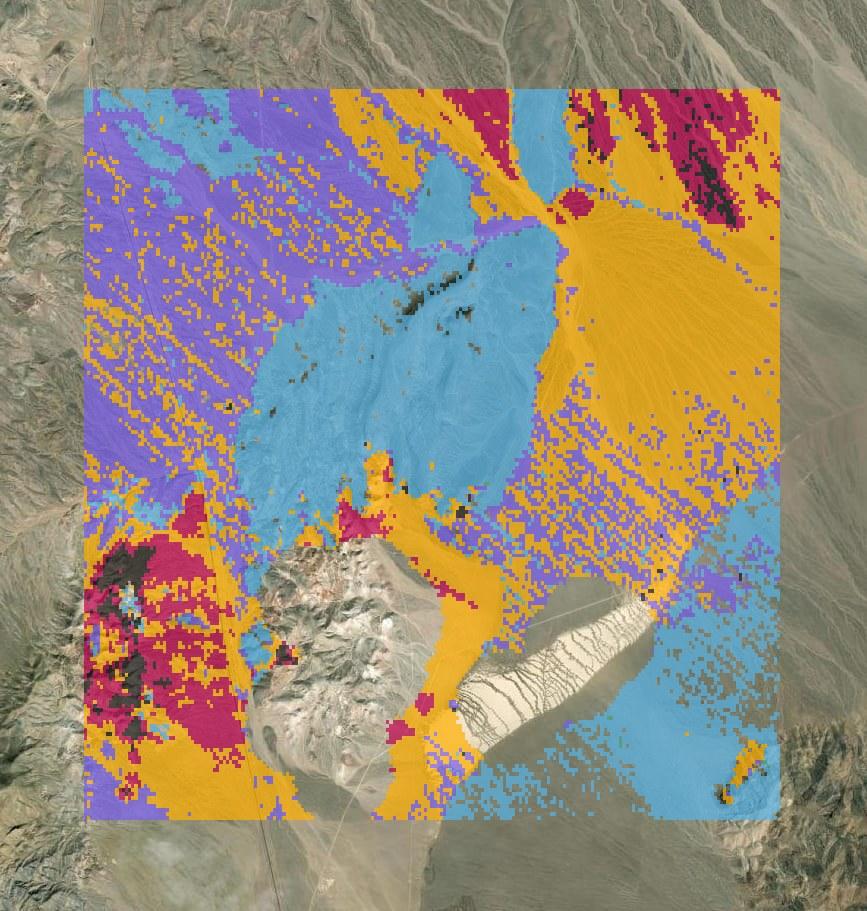
Las nubes, las sombras y los píxeles ilegibles se marcan como sin datos, y la proporción enmascarada se reporta con el resultado. En una escena mineral en vivo del espacio de trabajo de demostración esa proporción es 16.1%, declarada con claridad en lugar de plegarse a la clase más cercana.
La confianza se entrega con cada respuesta
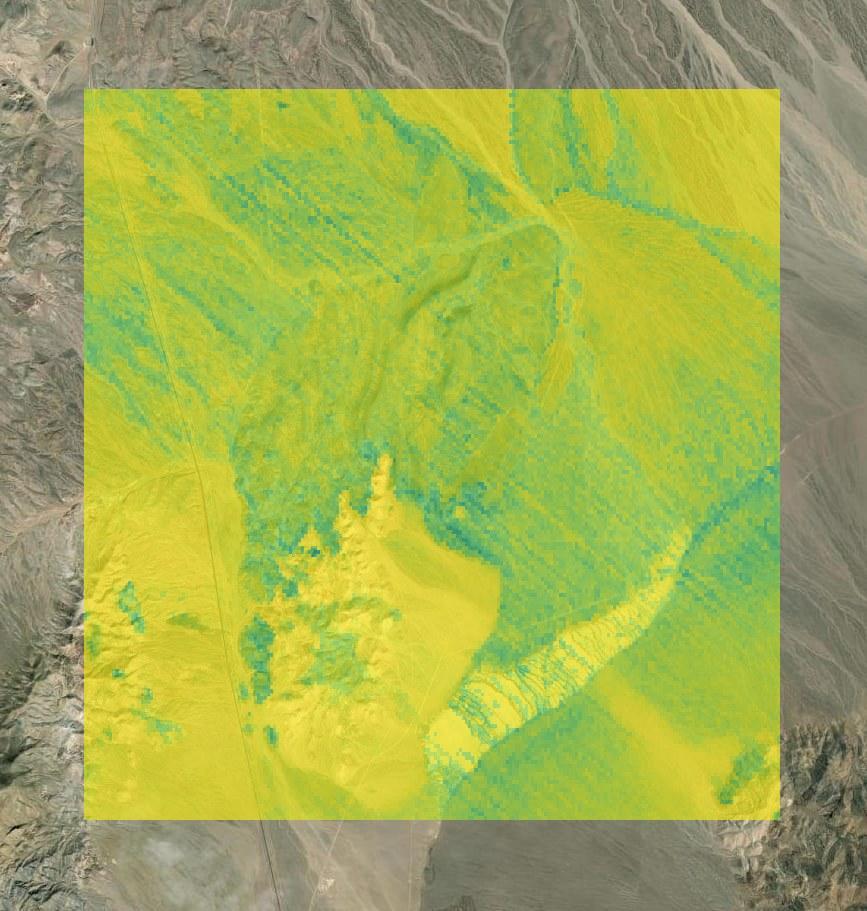
Una clasificación nunca se entrega sola. Cada una lleva una capa de calidad de ajuste por píxel que puntúa qué tan bien coincide el terreno con la clase que se le asignó, de modo que un lector pueda ver exactamente dónde el mapa es fuerte y dónde es débil.
Las estadísticas se publican tal como se midieron
Una estadística de escena es la media o el rango del valor medido sobre esa escena en esa fecha, y así se etiqueta. Una puntuación media de detección de -0.07 se reporta como -0.07.
Modelos congelados y versionados
Un modelo que puntúa terreno se fija antes de publicarse y se nombra en cada capa que produce. Los resultados no derivan bajo un modelo en movimiento, y dos mapas hechos con un mes de diferencia pueden compararse porque el mismo método versionado hizo ambos.
Verificaciones cruzadas independientes
La vía mineral se ejecuta de extremo a extremo contra un clasificador independiente de sistema experto sobre el mismo terreno, una verificación que no controlamos y no podemos ajustar. El acuerdo se gana, no se afirma.
Dónde se detienen los números
Cada cifra que reporta la plataforma es una medición a nivel de escena de una sola adquisición. Describe la respuesta de la superficie en un lugar y en una fecha, y está fechada para que usted pueda saberlo.
Los resultados minerales describen alteración superficial, nunca concentración, ley ni reservas. Las estadísticas de metano y vegetación son valores de cribado: clasifican terreno y dirigen la atención, y la medición de campo resuelve lo que plantean.