
Drive to the twenty fields that moved
Every field on your register gets one clear look a week, read against its own earlier seasons and marked steady or moved. Your agronomists see which fields changed before they leave the yard, and every figure traces back to its source scene.
01 · Who it is for
The people who file, settle and advise
Retail agronomy leads
Agronomy and precision ag managers at independent retailers and co-ops, judged on acres per agronomist.
Crop consultants
Certified crop advisers with their own name on the work, who need a written record a landlord or lender can read.
Crop insurers
Claims managers at approved insurance providers who need the season’s record, weather and soil for each claim.
Agricultural lenders
Appraisers and portfolio managers checking what grew on a farm, season by season.
Budgets
Retailers and consultants set next season’s budget between October and January. A record running on twenty fields before then is the easiest case to make.
Claims tools
Crop insurers choose claims tools over the winter, before the 15 March sales closing date for spring crops.
Paragraph 62
The 2026 Prevented Planting Standards Handbook pilots settling a prevented planting claim on remote-sensed imagery and supporting records, in place of a field inspection.
02 · Products
What you can order
Each product is ordered over your own plots, fields, stands or assets, and comes back as a document and a set of map layers.
Field register and weekly record
One clear look a week for every field, read against its own earlier seasons and marked steady or moved.
43-year field history
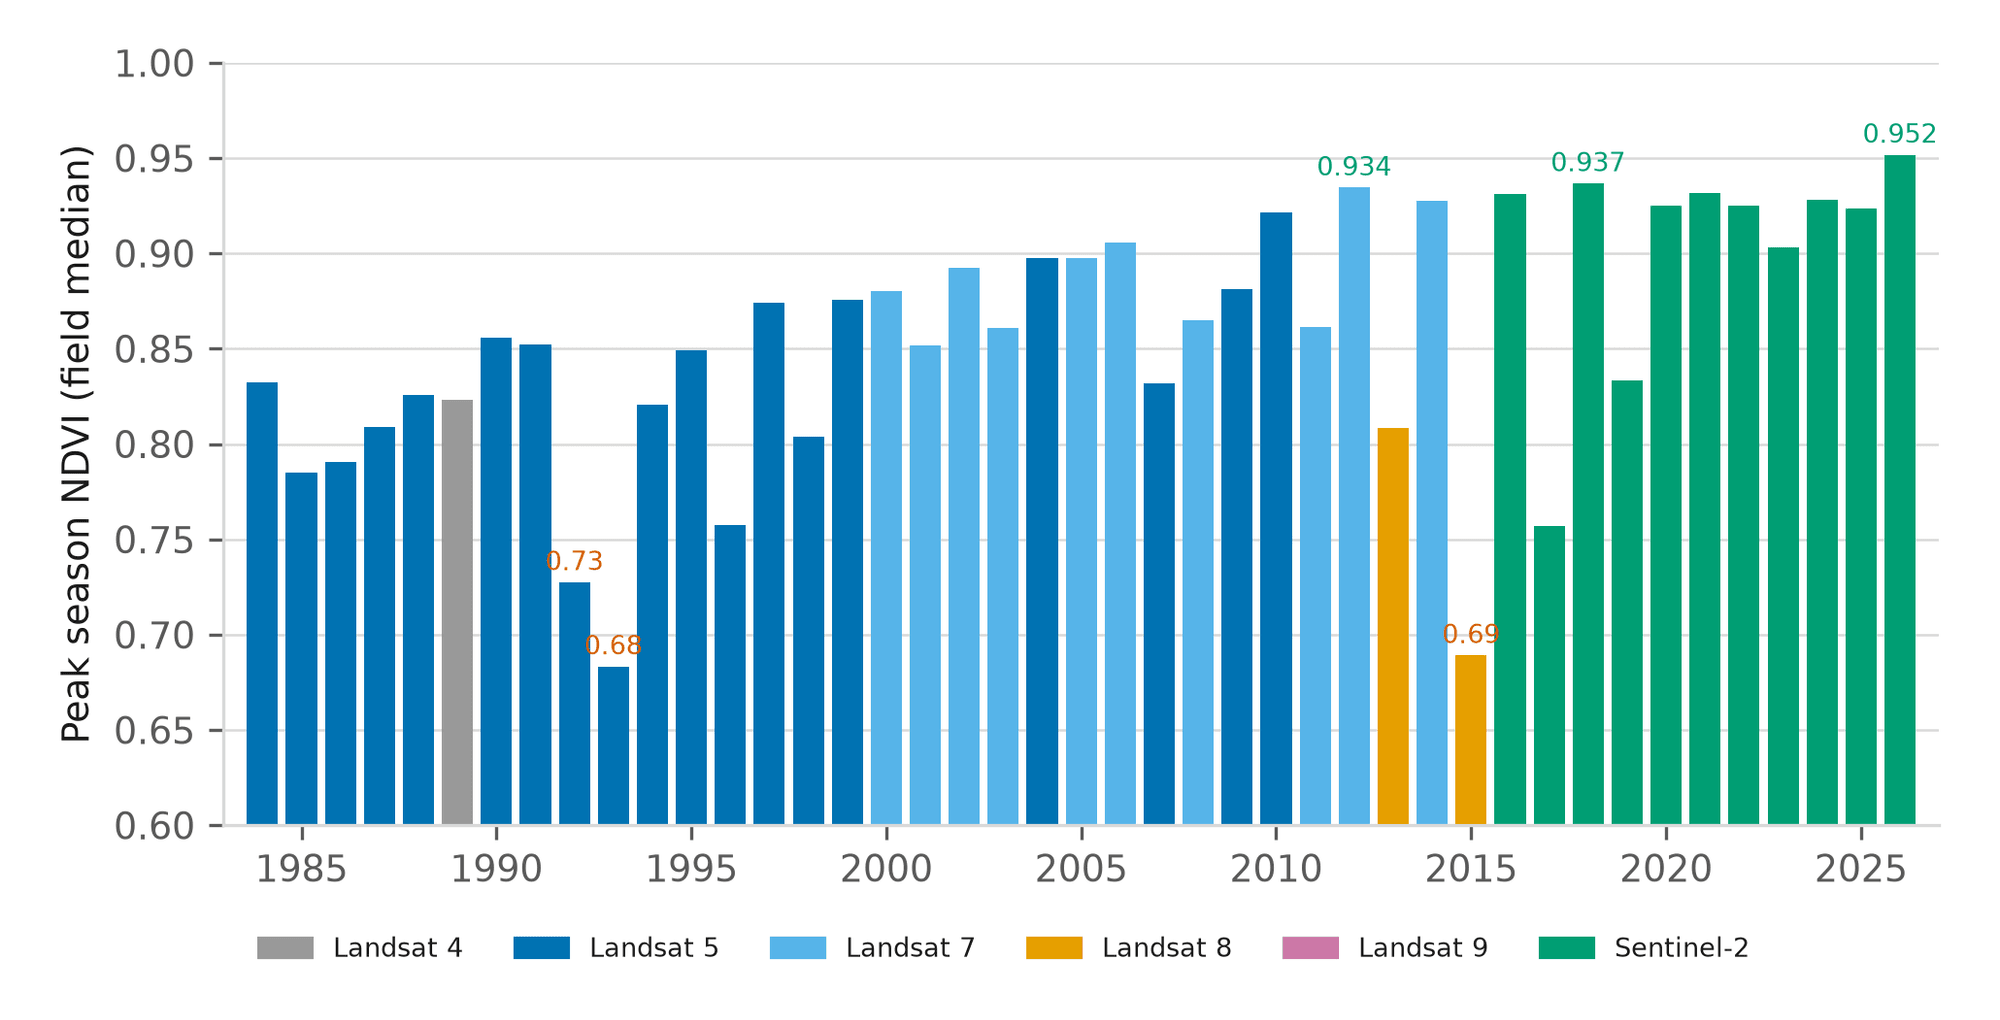
One bar a year for every field since 1984, each naming its sensor, with the field’s highest and lowest seasons.
Management zones
Split a field into three to five zones from its own last several seasons, and attach a rate per zone for export.
Scouting app
The field register on a phone: this week’s status, tasks and photos pinned to the field, and work that keeps going offline.
White label editions
The field record under your own name, with a workspace for each grower you serve and every record issued by you.
Crop classification
What crop stood on an area in a season, as a map and as parcels, with your own field truth taking precedence where you have it.
Land cover classification
An area classified into ESA WorldCover classes for a chosen season, and what changed between two periods.
Field boundaries
Candidate field outlines over an area for one closed season, each with a confidence by field size, for review.
Yield prediction
A per-field yield estimate with an 80 percent interval, and the back-test of the county model behind it printed beside it.
Soil moisture
Whether the soil is wetter or drier than normal right now, at the surface and at root depth, against the field’s own history.
Agroclimatic report
A one-page season brief: heat units, rain, frost and heat days, drought and soil moisture, against the area’s own normal.
Disease risk forecast
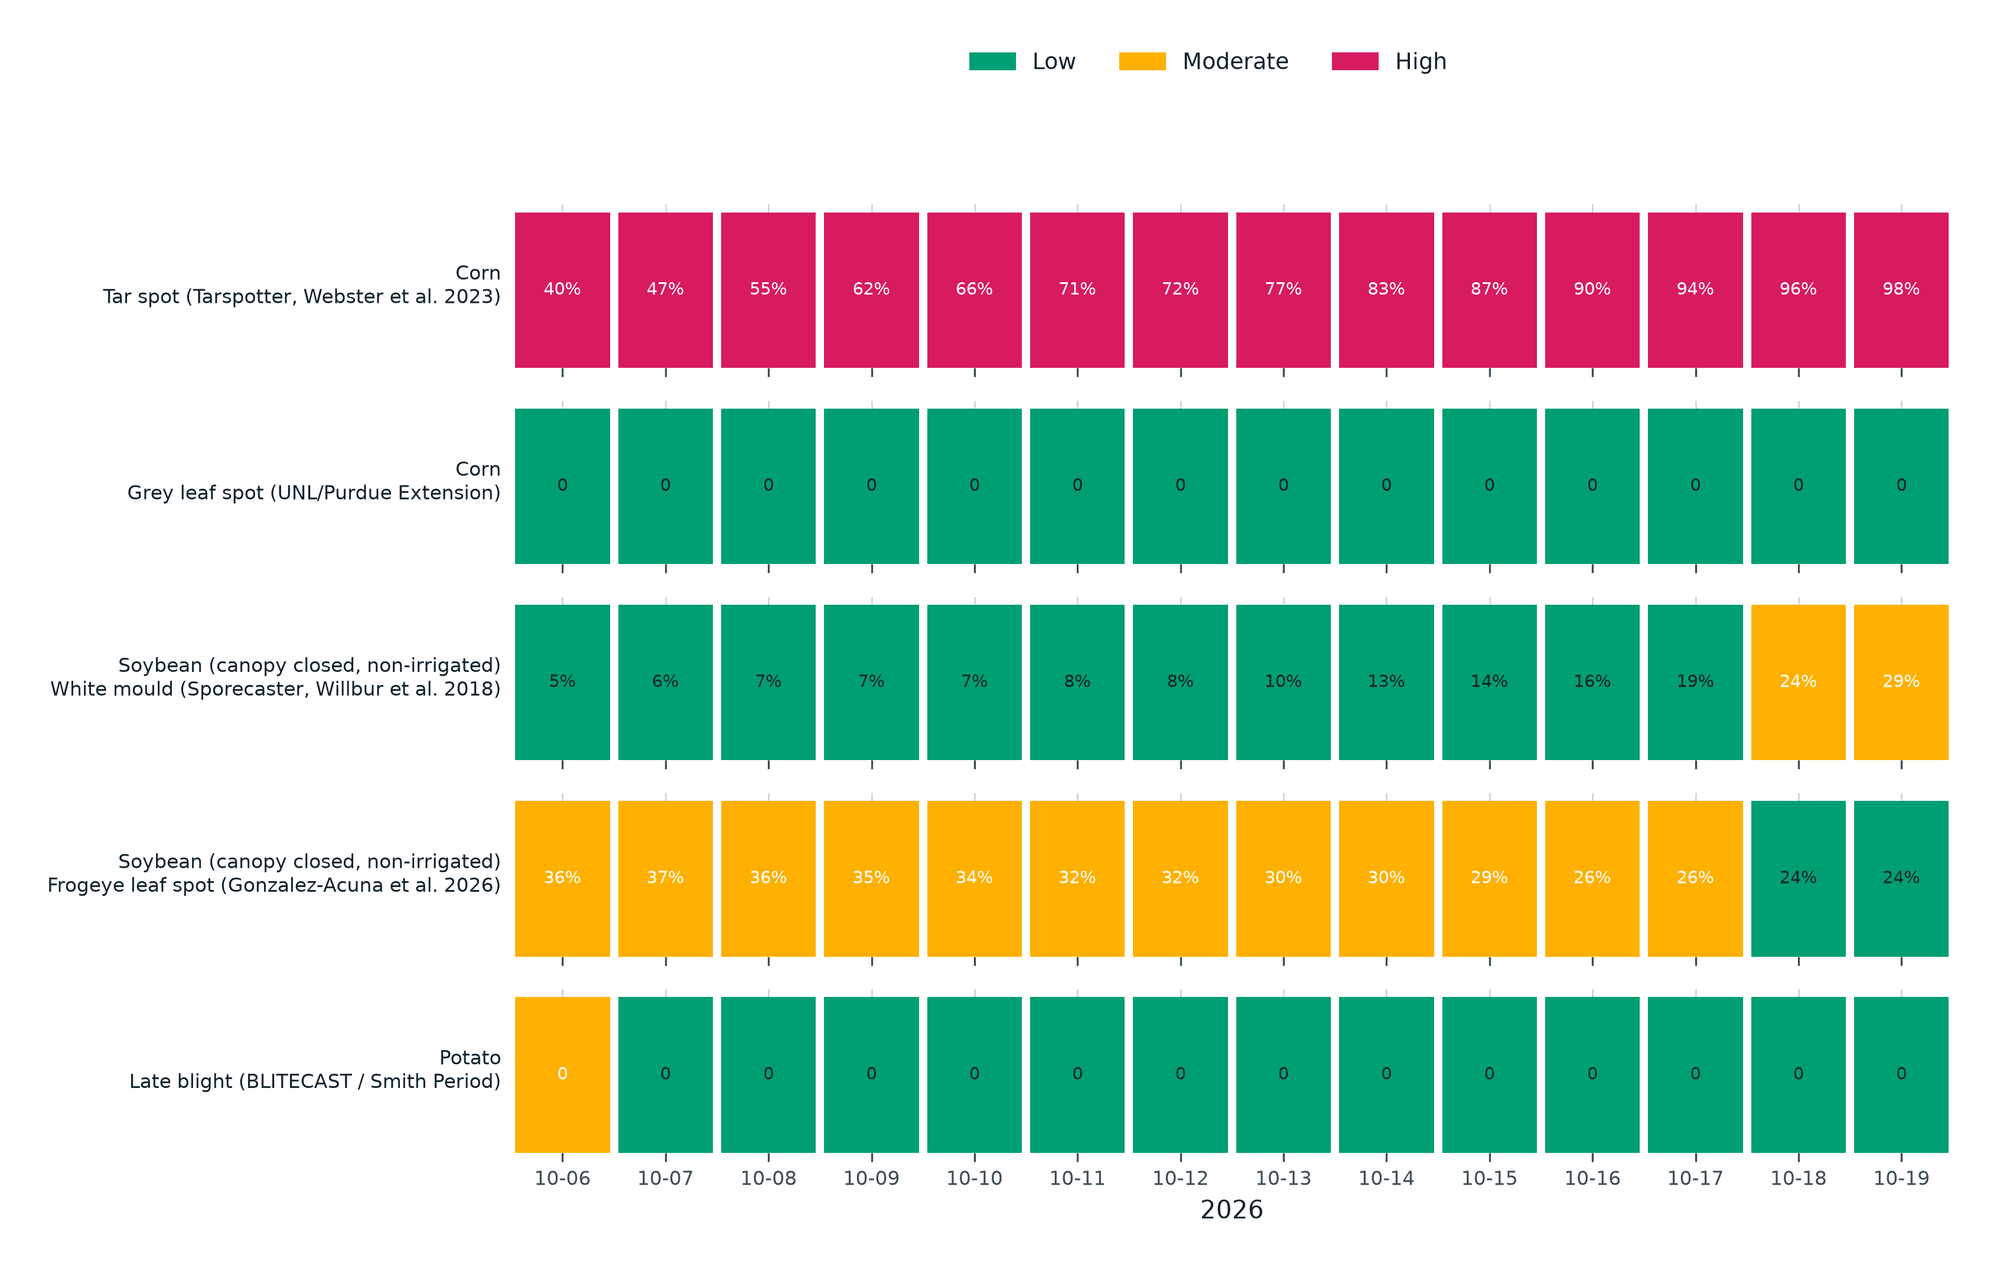
A daily risk class for the next 14 days from published disease models, run on the field’s own weather forecast.
Variable-rate maps
Management zones from this season’s vegetation, the field’s terrain and its moisture pattern, with a rate per zone.
Season analytics
Growth stage, the season against earlier ones, the fields to look at first, and a season-end PDF under your brand.
Flood extent and risk
Where water stood after a flood, read from radar, which parcels sat in it, and a terrain exposure class for the ground.
Climate risk scan
Seven hazard classes for every asset in a book, from long weather records and public hazard archives.
03 · What comes back
A document you can forward, and the layers behind it
- 01A weekly status for every field: steady, moved, or no clear look
- 02A field record PDF with the history back to 1984, weather and growing degree days, and every scene named
- 03Crop type per field and season, with the public source named
- 04Management zones with a rate per zone, exported as shapefile, GeoJSON or CSV
- 05A scouting app your agronomists and growers install on their phones
- 06All of it under your brand, with a workspace for each grower you serve
04 · The record behind it
Measured on control sets, counted plot by plot
Every figure below is printed with its denominator in a dated paper. Each one links to the document it comes from.
- 43 of 43
- seasons with a reading for one Nebraska centre pivot, 1984 to 2026, from Landsat and Sentinel-2
- 0.96
- of held-out corn pixels in three Iowa counties read as corn, against the USDA Cropland Data Layer, 2021 season
- 44 of 47
- candidate boundaries correct on fields of 20 to 60 hectares, Gray County, Kansas, 2018 season
A weekly field record from forty-three years of open imagery, Axine Labs, 2026
A weekly field record from forty-three years of open imagery, Axine Labs, 2026
A weekly field record from forty-three years of open imagery, Axine Labs, 2026
05 · Case studies
Read on real ground
Forty-three seasons of one Nebraska pivot, and its first zone map
Before driving out, an agronomist wants to know whether this season is unusual for this field, not for the county. One centre pivot near Seward has a reading for every season from 1984 to 2026, and 2026 is the highest of them.
A Kansas season on one page, and the next two weeks of disease pressure
A 61-hectare corn pivot in western Kansas, 184 days into the 2026 season: 53 days at or above 35 °C against a normal of 27.8, more heat units than usual, and five published disease models run on the field's own forecast.
Send us twenty fields
Send twenty field boundaries. The record comes back within 48 hours as a PDF with the layers, and the rest of your book can run under your own name.