
Forty-three seasons of one Nebraska pivot, and its first zone map
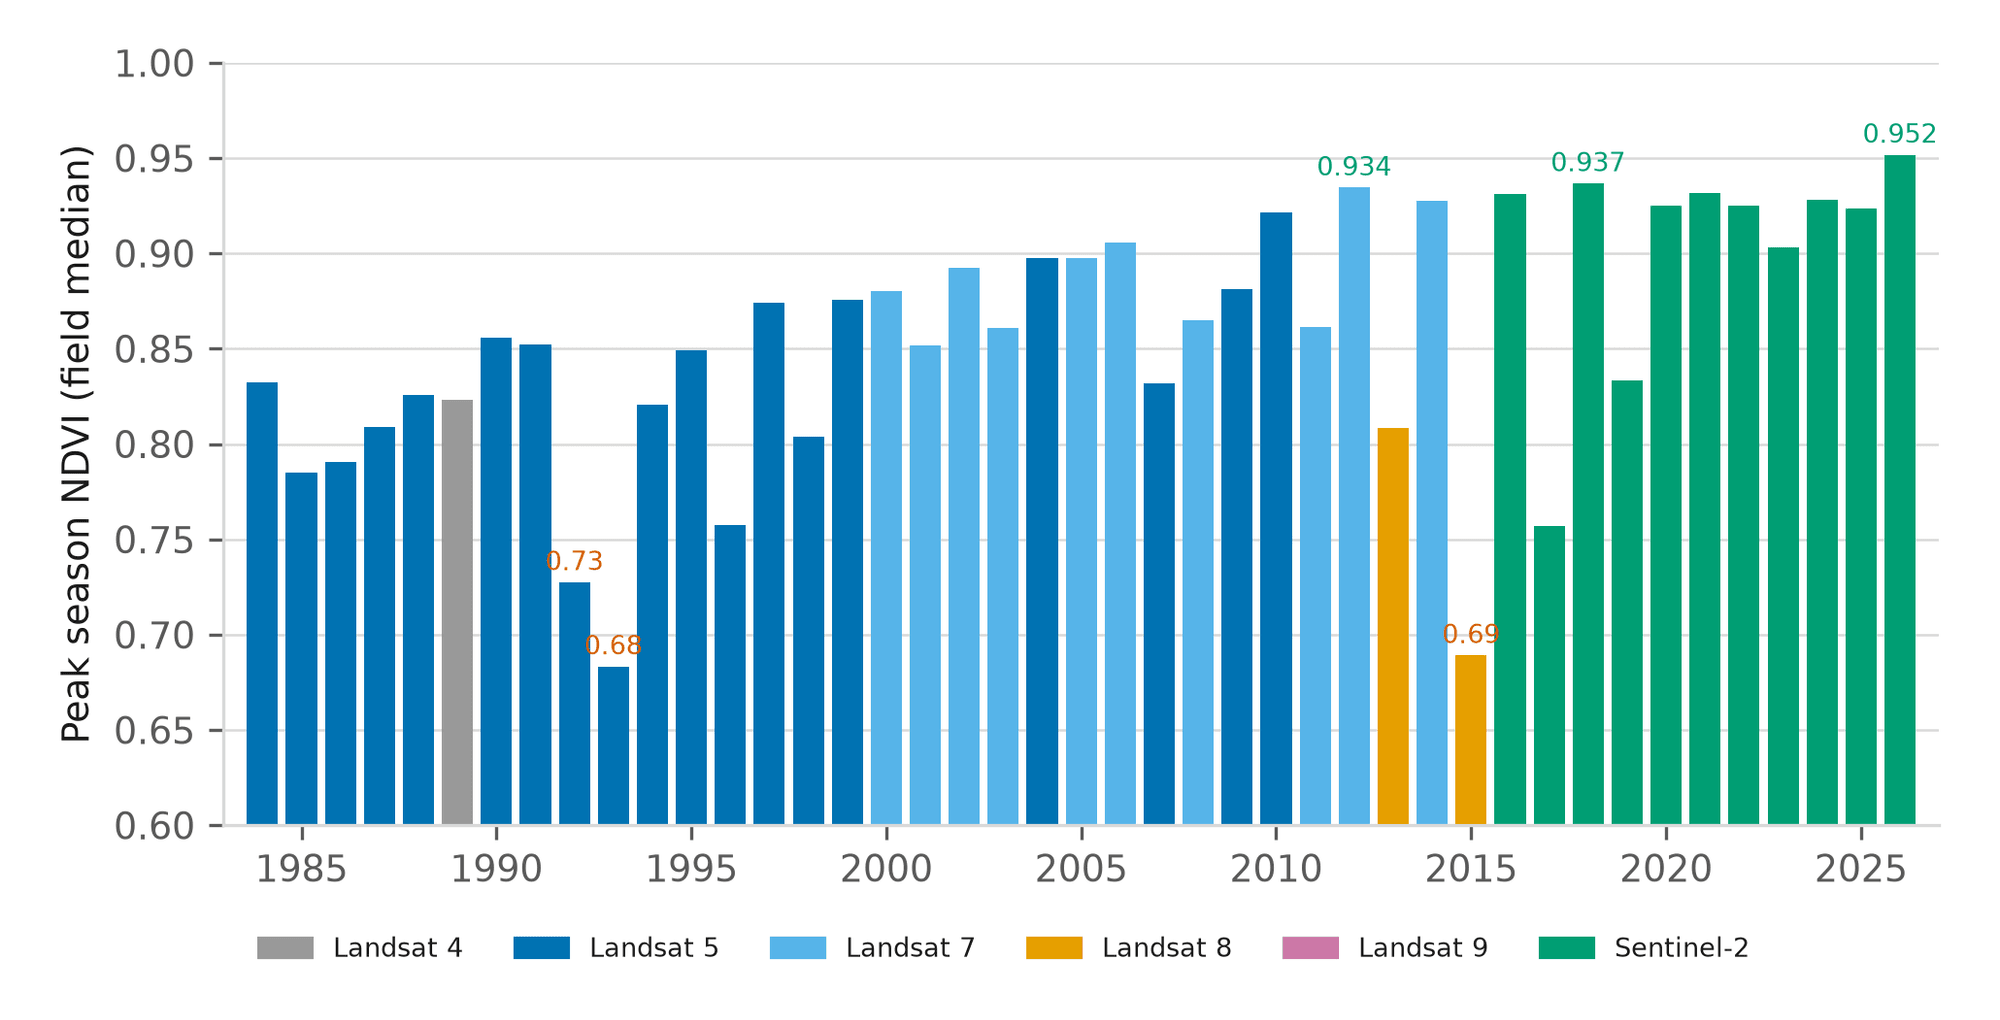
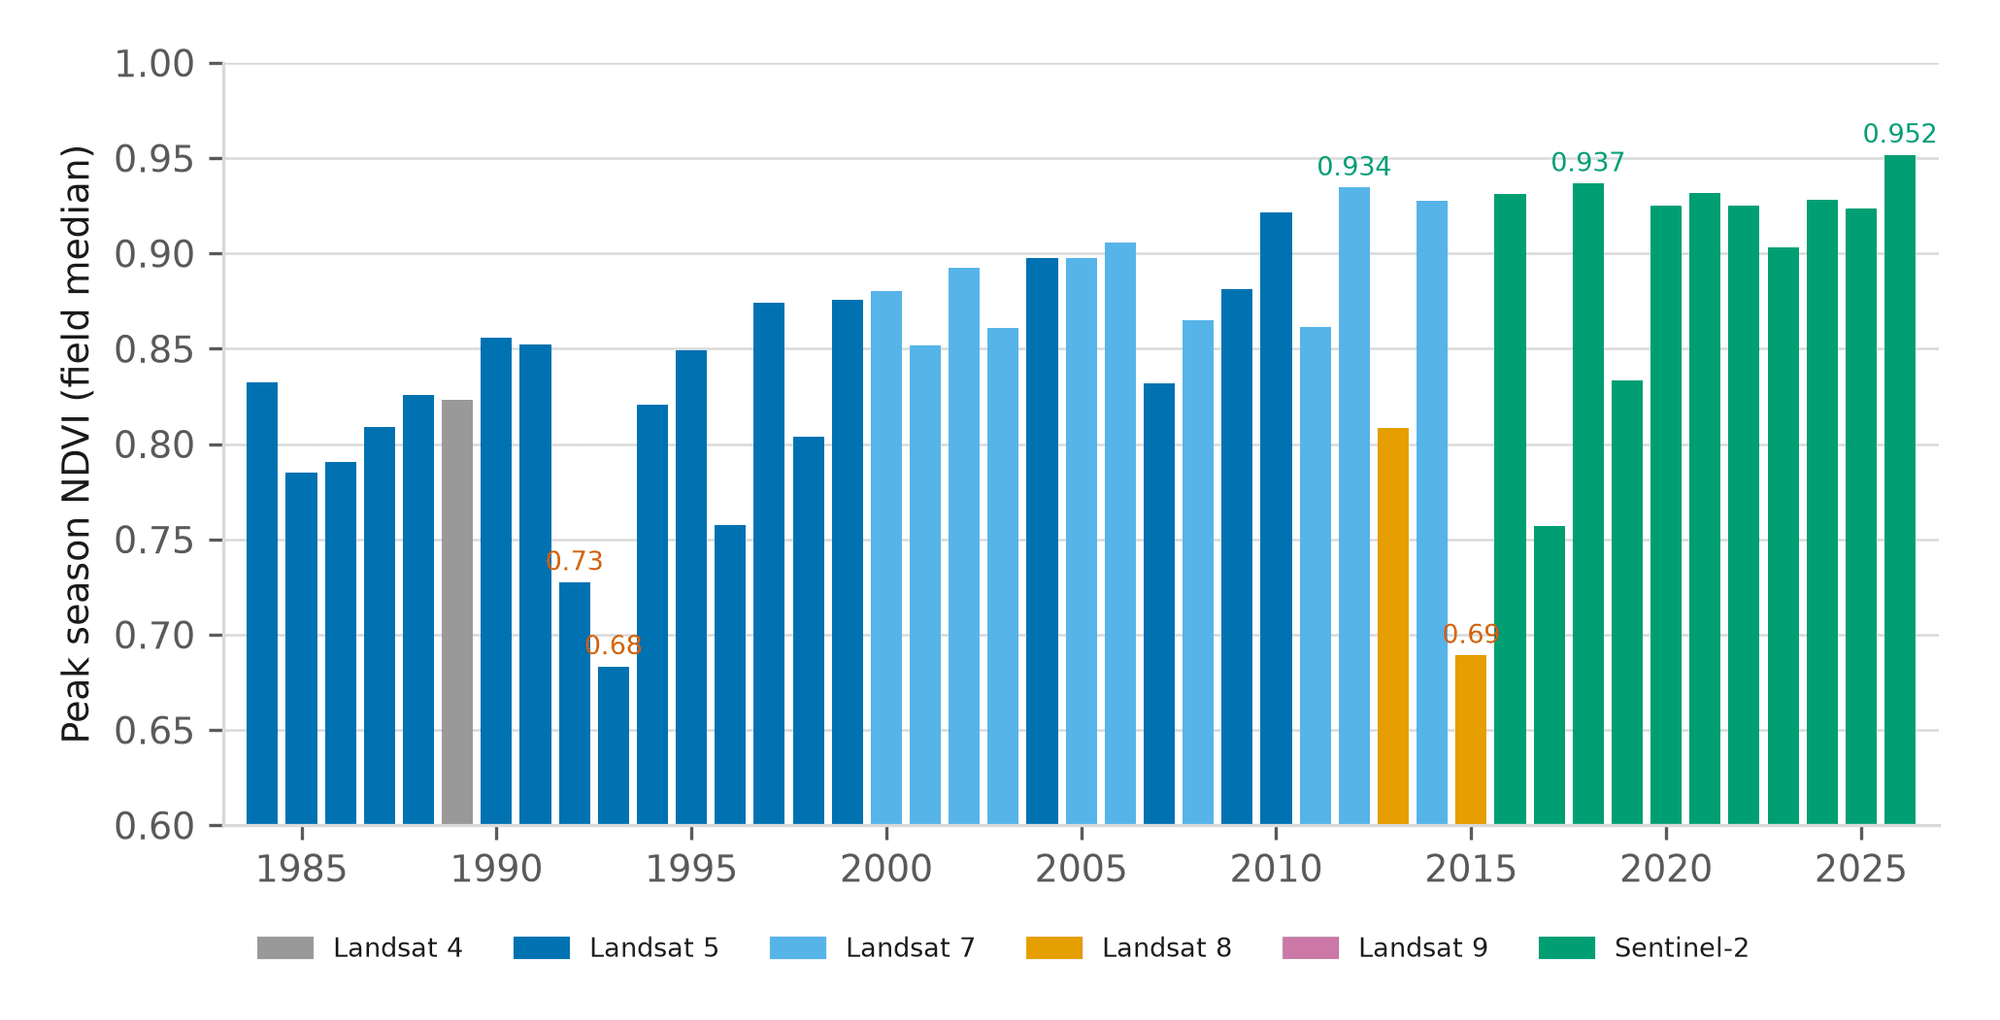
Before driving out, an agronomist wants to know whether this season is unusual for this field, not for the county. One centre pivot near Seward has a reading for every season from 1984 to 2026, and 2026 is the highest of them.
- Field
- Centre pivot near Seward, Nebraska
- Area
- 47.4 ha, corn
- Record
- 1984 to 2026
- Seasons read
- 43 of 43
- Highest seasons
- 2026, 2018, 2012
- Lowest seasons
- 1993, 2015, 1992
- Zones
- 17.8, 15.5, 13.4 ha
- Products
- Field register, history, zones
The problem
An agronomy lead is measured on acres per agronomist. Before a drive, the question is whether this season is unusual for this field, not for the county.
What we did
Every season since 1984 read from Landsat and Sentinel-2, each bar naming its sensor, then the same pivot split into three management zones.
The result
A reading for all 43 seasons, 2026 the highest on record, and a first zone map to put on the table with the grower.
Overview
A centre pivot near Seward, Nebraska, 47.4 hectares in corn, is one of the test fields behind the field register. Every season of the open satellite record falls over it, which makes it a good place to show what a field's own history looks like when every year is read.
This is one of our own test cases. The same record comes back for any field on the register, and for one field free from the free field record.
The challenge
An agronomist at an independent retailer, or a crop consultant, has more fields than days. Before driving out, the useful question is not whether a field looks green. It is whether it looks different from what this field usually does in this week of the season.
A county average cannot answer that. Every field has its own soil, its own drainage and its own history of management, and a field that is always a little behind is not a problem in a year when it is a little behind.
What we did
For each season from 1984 to 2026 we took the field's peak canopy reading, using only looks that were clear of cloud across the whole field. Landsat carries the years before 2016 and Copernicus Sentinel-2 the years since, and every bar names the sensor it came from.
The same pivot was then split into three management zones from this season's vegetation, the field's terrain from the Copernicus DEM, and its moisture pattern from Sentinel-1 radar.
What the record showed
| Seasons on record | 43, 1984 to 2026 |
| Seasons with a reading | 43 |
| Highest seasons | 2026, 2018, 2012 |
| Lowest seasons | 1993, 2015, 1992 |
| Sensors | Landsat 4, 5, 7 and 8, then Sentinel-2 from 2016 |
Every season has a reading. 2026 is the highest on record, ahead of 2018 and 2012. The weakest were 1993, 2015 and 1992.
For an agronomist in 2026 that settles the first question. This field is not having a bad year; it is having its best one, and the drive can go to a field that moved.
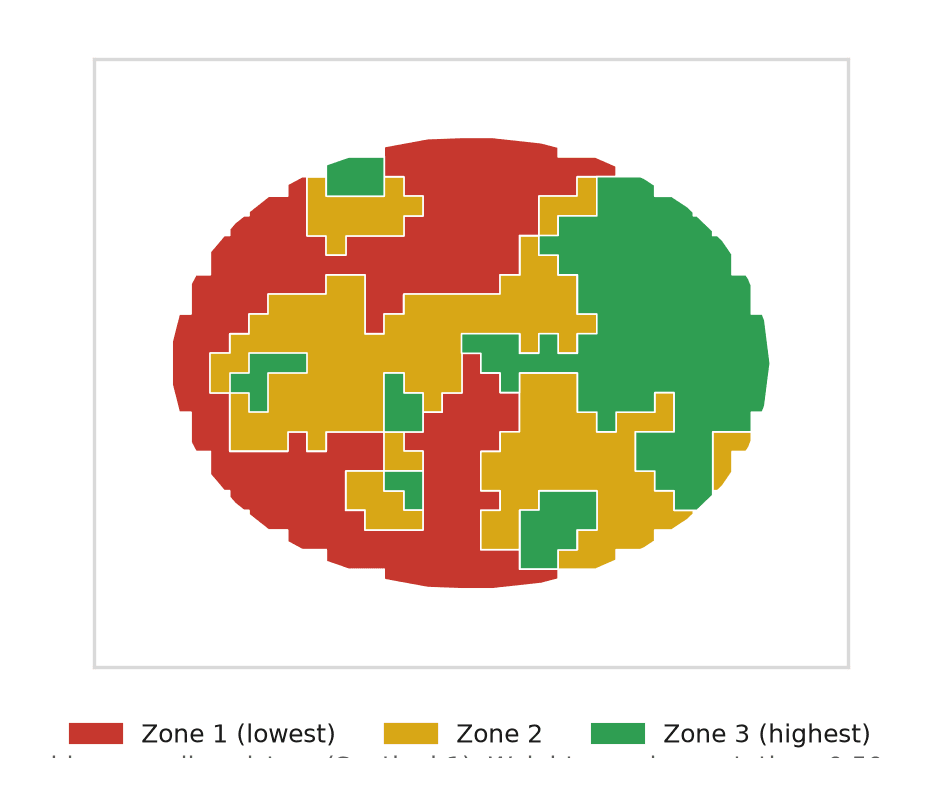
The three zones come to about 17.8, 15.5 and 13.4 hectares. The agronomist sets a rate per zone, and the zone map exports for the equipment.
What it means
For a retailer's agronomy team, the field's own history is the baseline every weekly status is read against. A field is flagged when it moves against its own range, which is how twenty fields that moved come out of a book of a thousand.
For a consultant, the history is also something written to show a landlord or a lender: every season since 1984, each bar with its sensor, in a PDF under the consultant's own name.
Run this on your own ground
Draw an area of interest, pick the dates, and the same analysis runs against the archive over your sites.
References
- Axine Labs (2026). A weekly field record from forty-three years of open imagery. Sections 2 and 3.6.
- U.S. Geological Survey. Landsat Collection 2. usgs.gov/landsat-missions
- European Space Agency. Copernicus Sentinel-2 mission. sentinels.copernicus.eu
- Georgi C., Spengler D., Itzerott S., Kleinschmit B. (2018). Automatic delineation algorithm for site-specific management zones based on satellite remote sensing data. Precision Agriculture 19, 684 to 707. doi.org/10.1007/s11119-017-9549-y
More case studies
Storm Johannes: which stands to visit first, ranked from open imagery
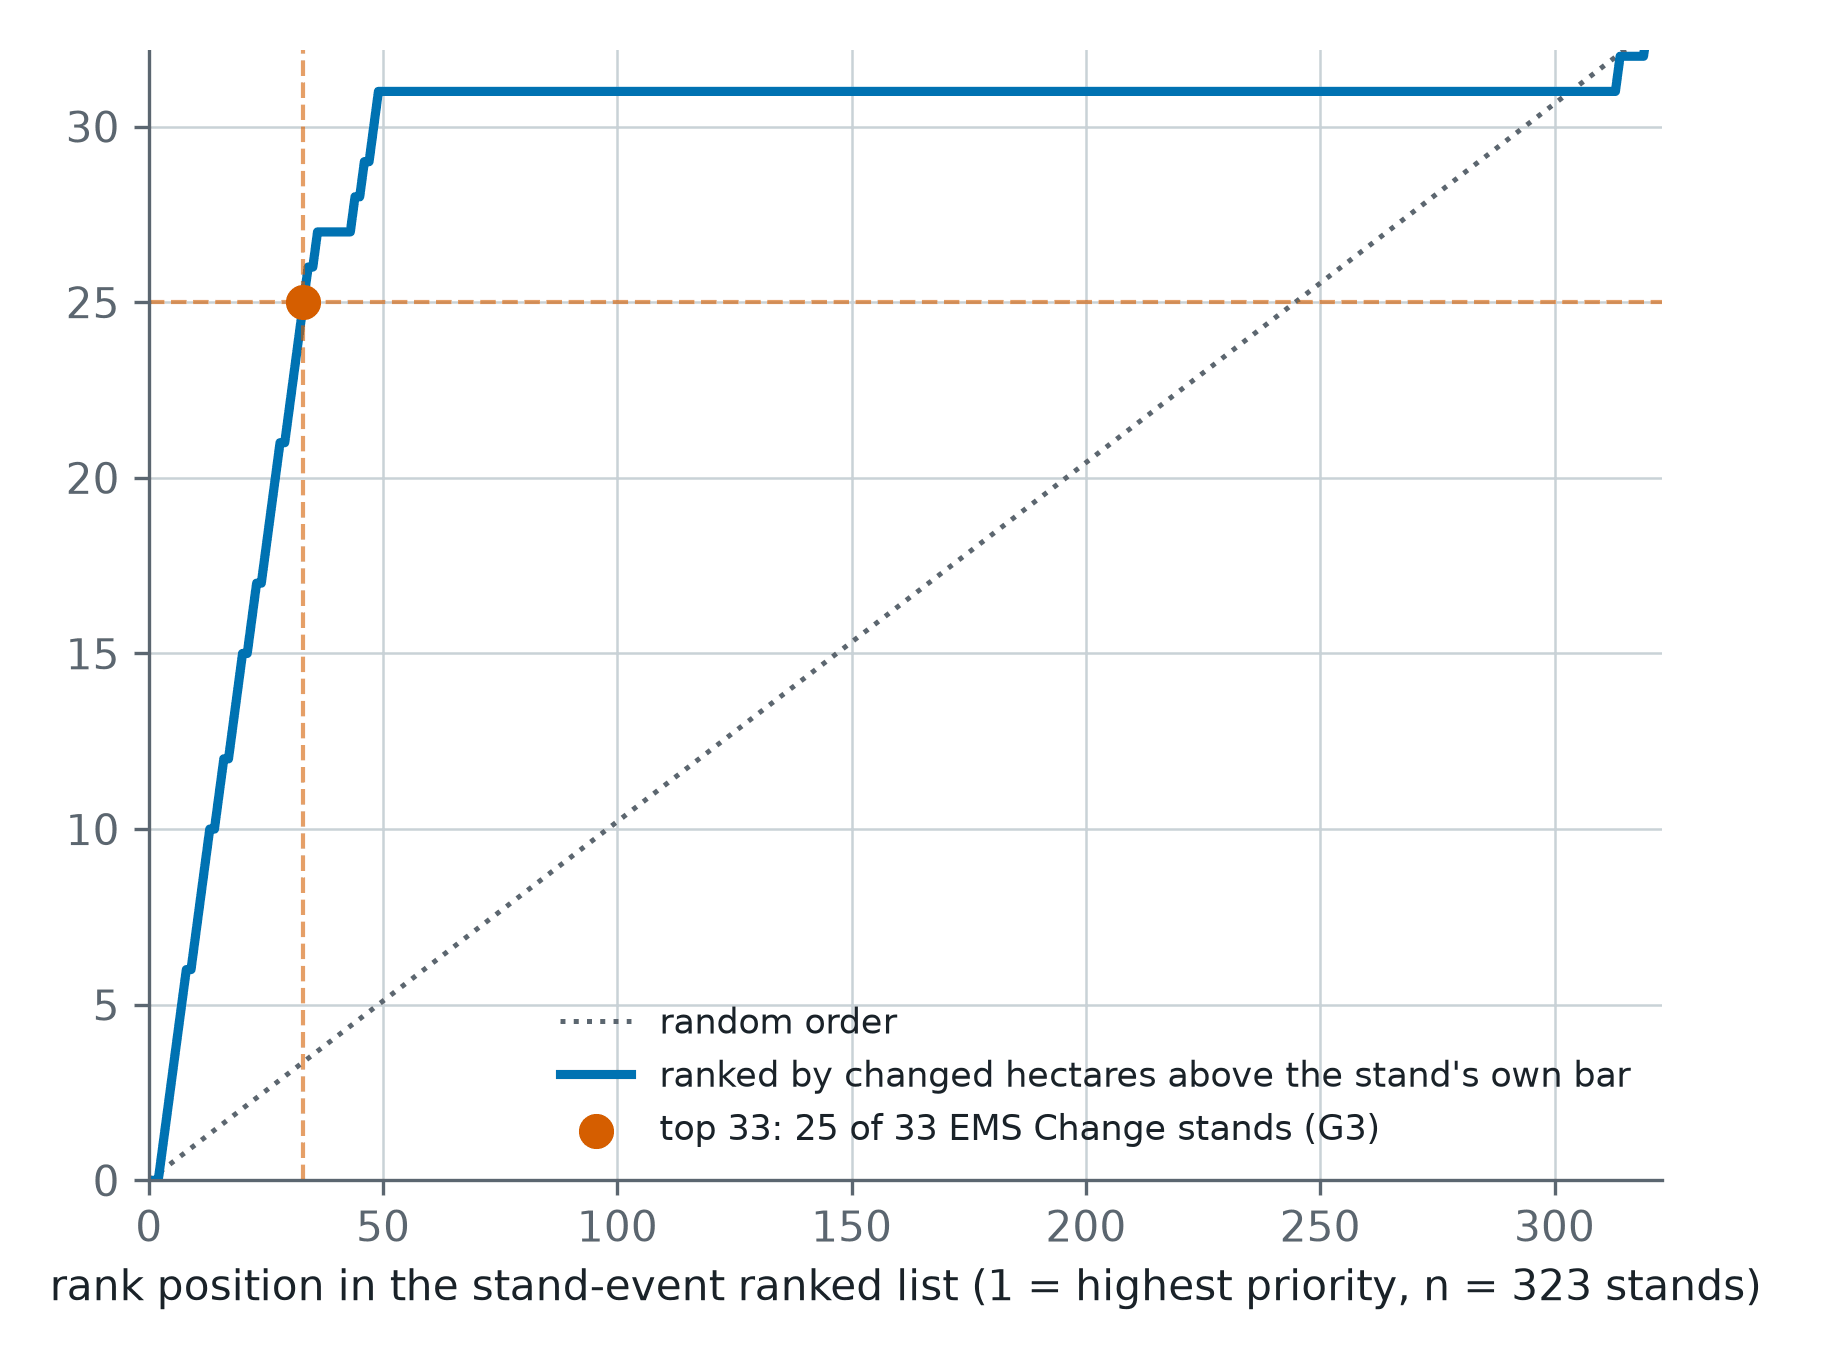
After the December 2025 storm in central Sweden, 323 test stands were ranked from Sentinel-1 and Sentinel-2. Of the 33 the storm had changed, 25 sat in the top 33 of the list. Random order would have put three or four there.
A Kansas season on one page, and the next two weeks of disease pressure
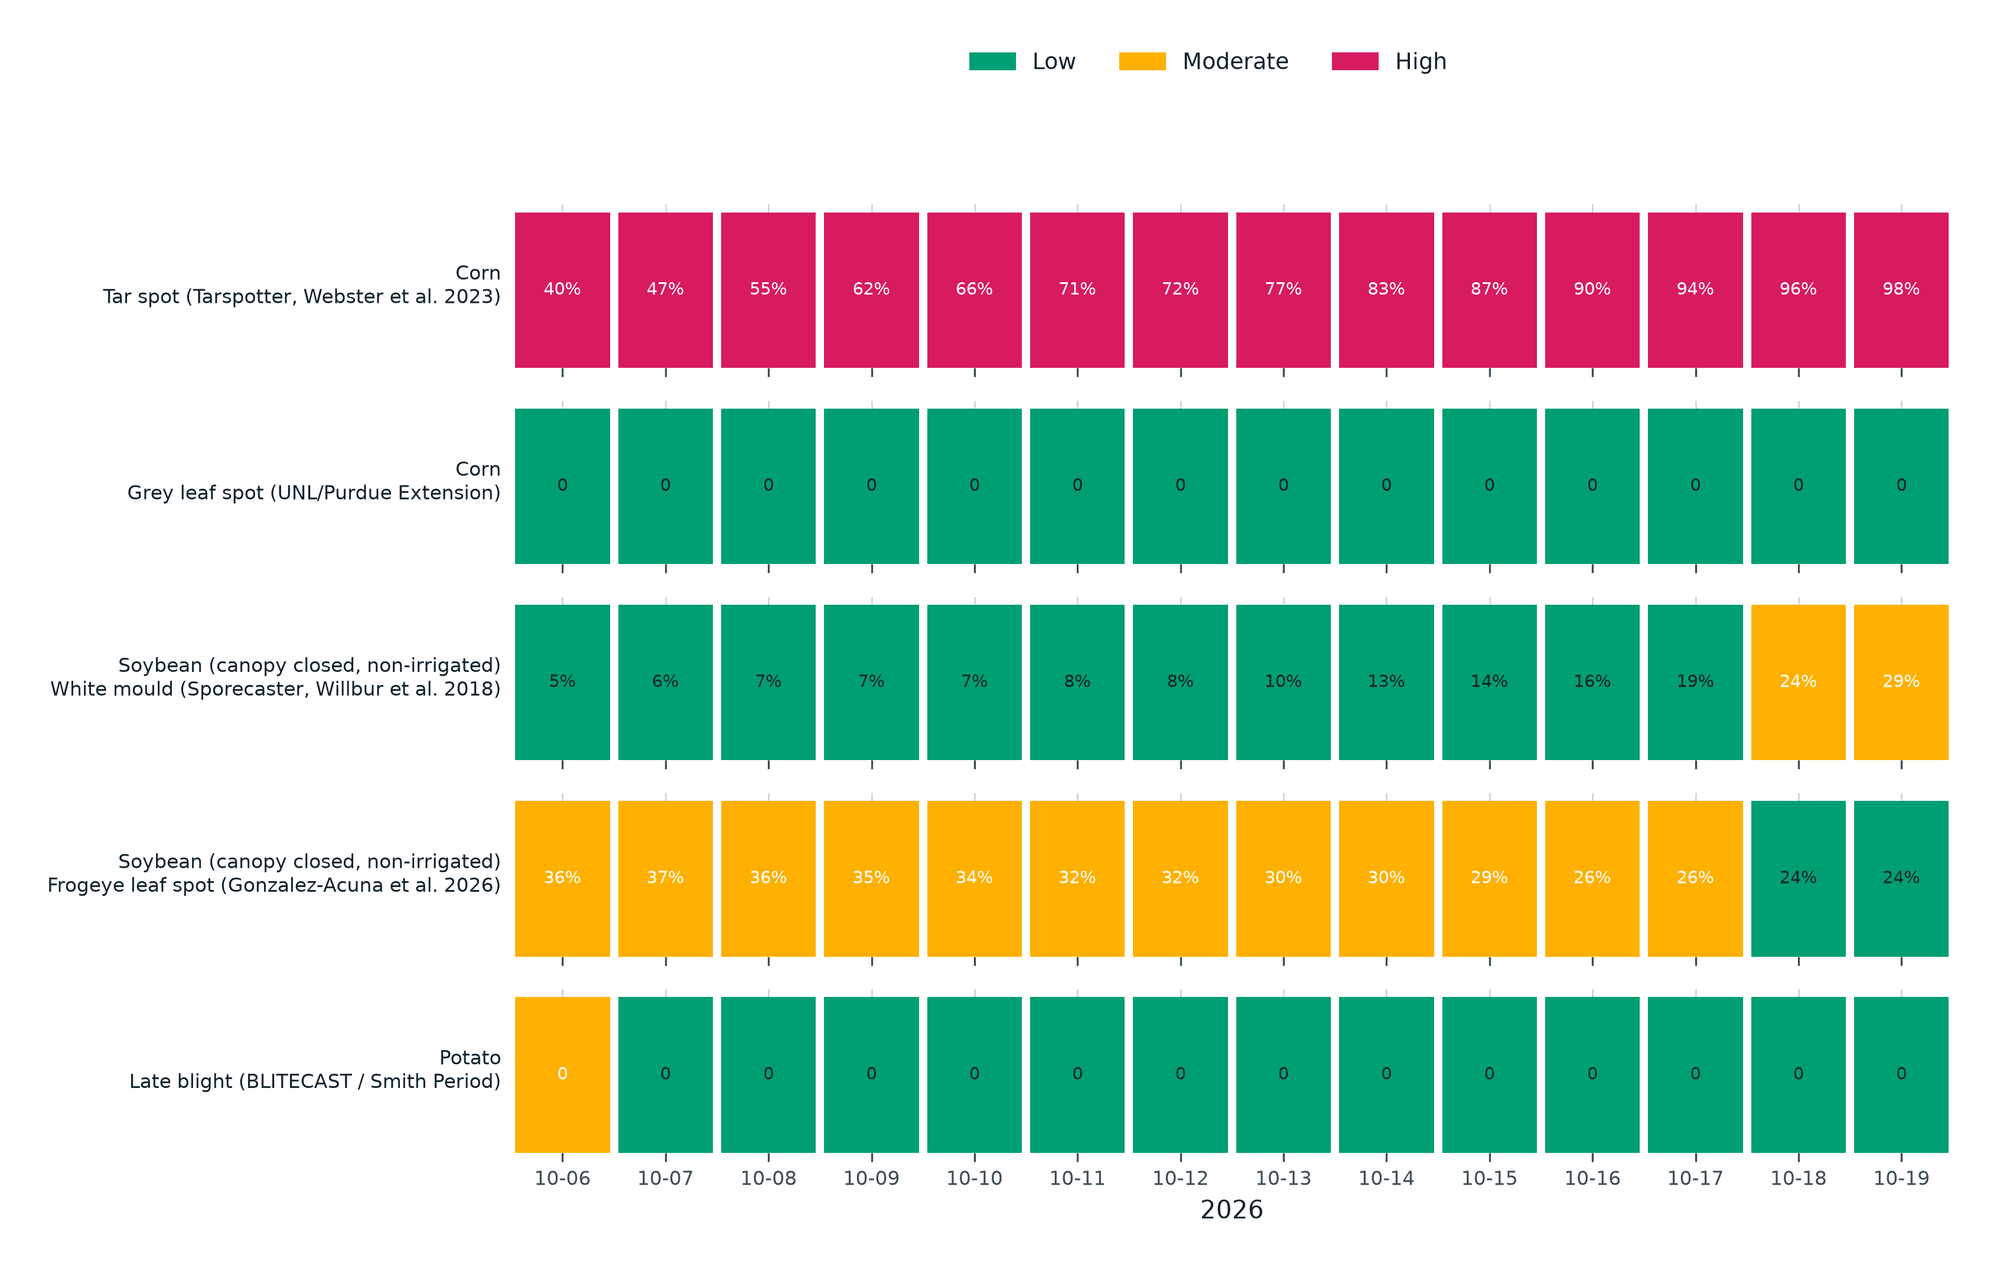
A 61-hectare corn pivot in western Kansas, 184 days into the 2026 season: 53 days at or above 35 °C against a normal of 27.8, more heat units than usual, and five published disease models run on the field's own forecast.
Three Italian assets, each read against its own history
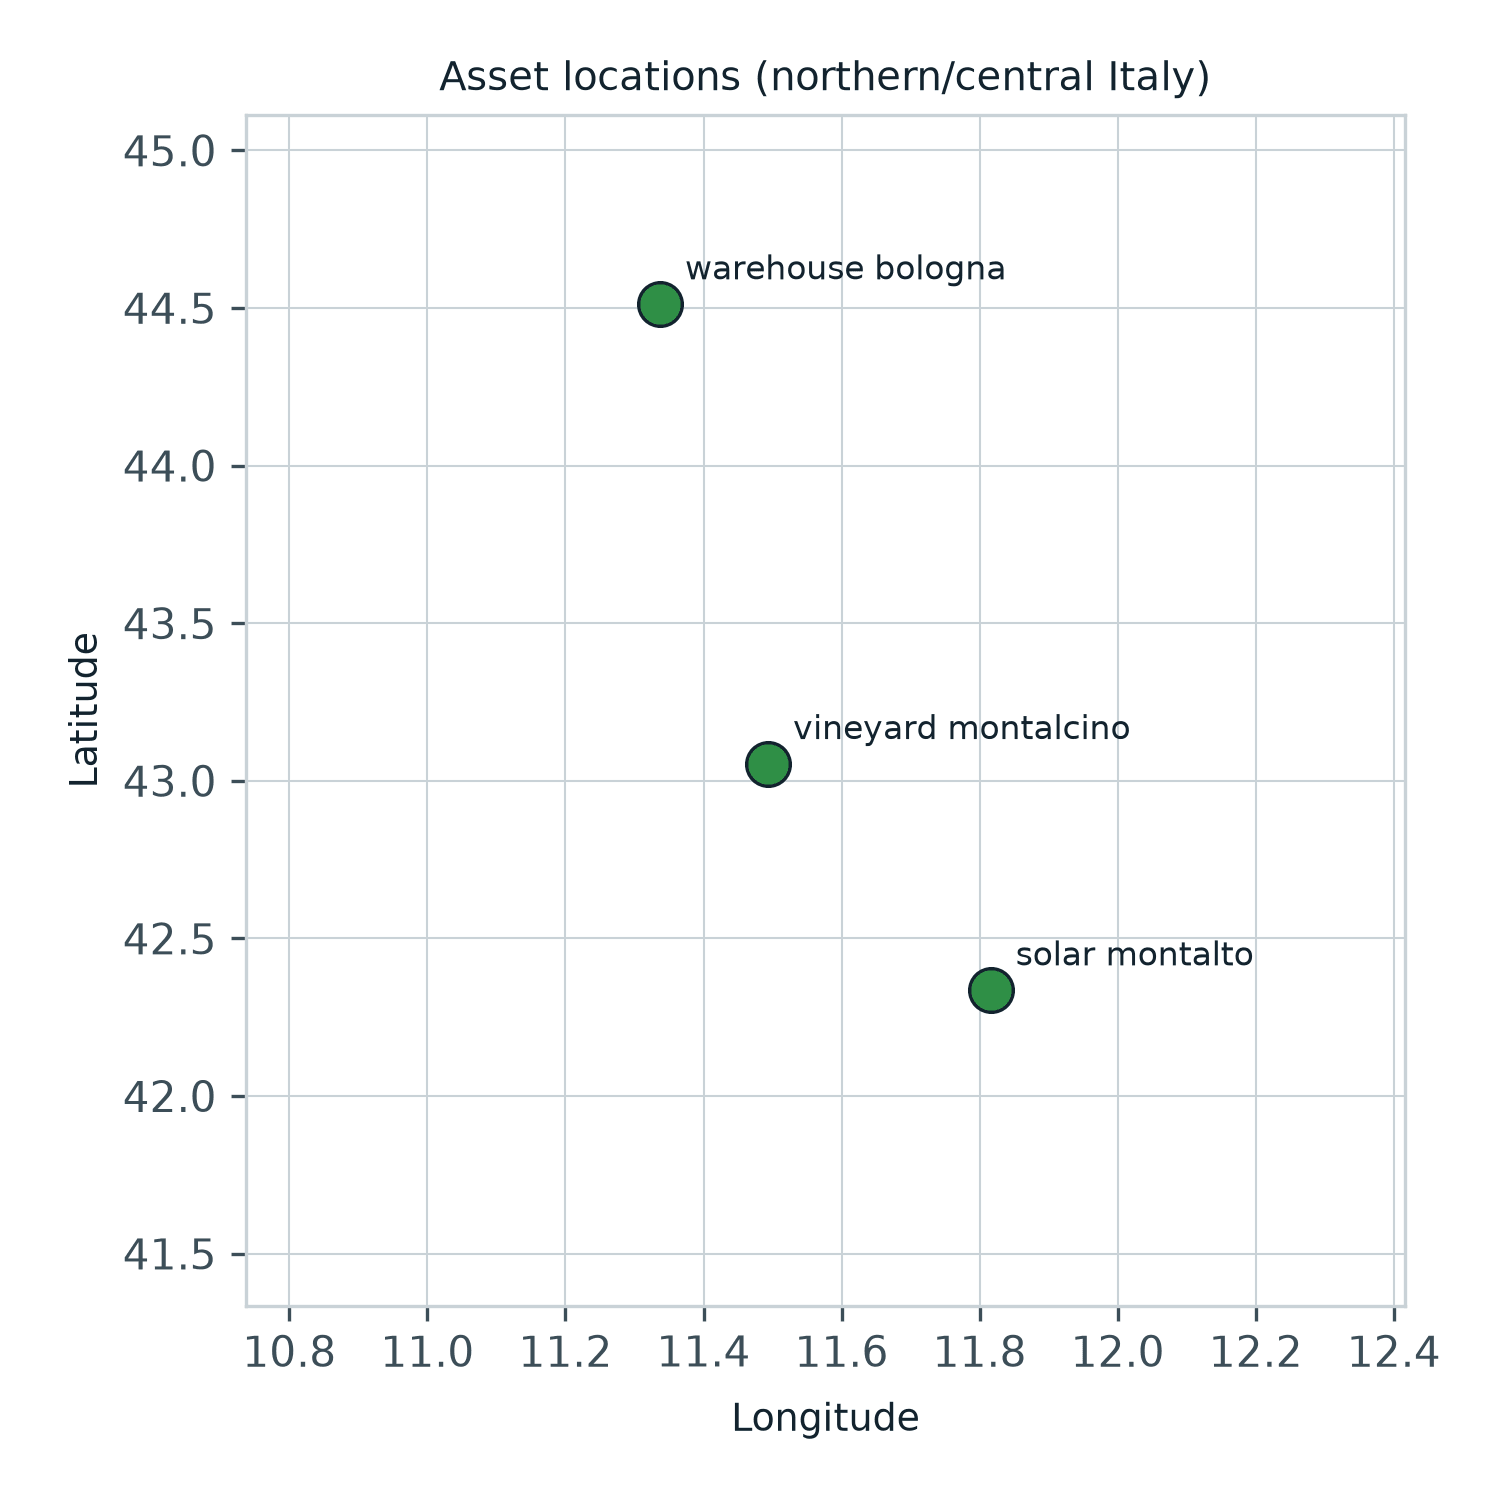
A warehouse changes almost never, a vineyard changes every season. Read against their own previous three years, a warehouse, a solar farm and a vineyard all sat within their usual range, and a second read returned the same figures.