
Three Italian assets, each read against its own history
A warehouse changes almost never, a vineyard changes every season. Read against their own previous three years, a warehouse, a solar farm and a vineyard all sat within their usual range, and a second read returned the same figures.
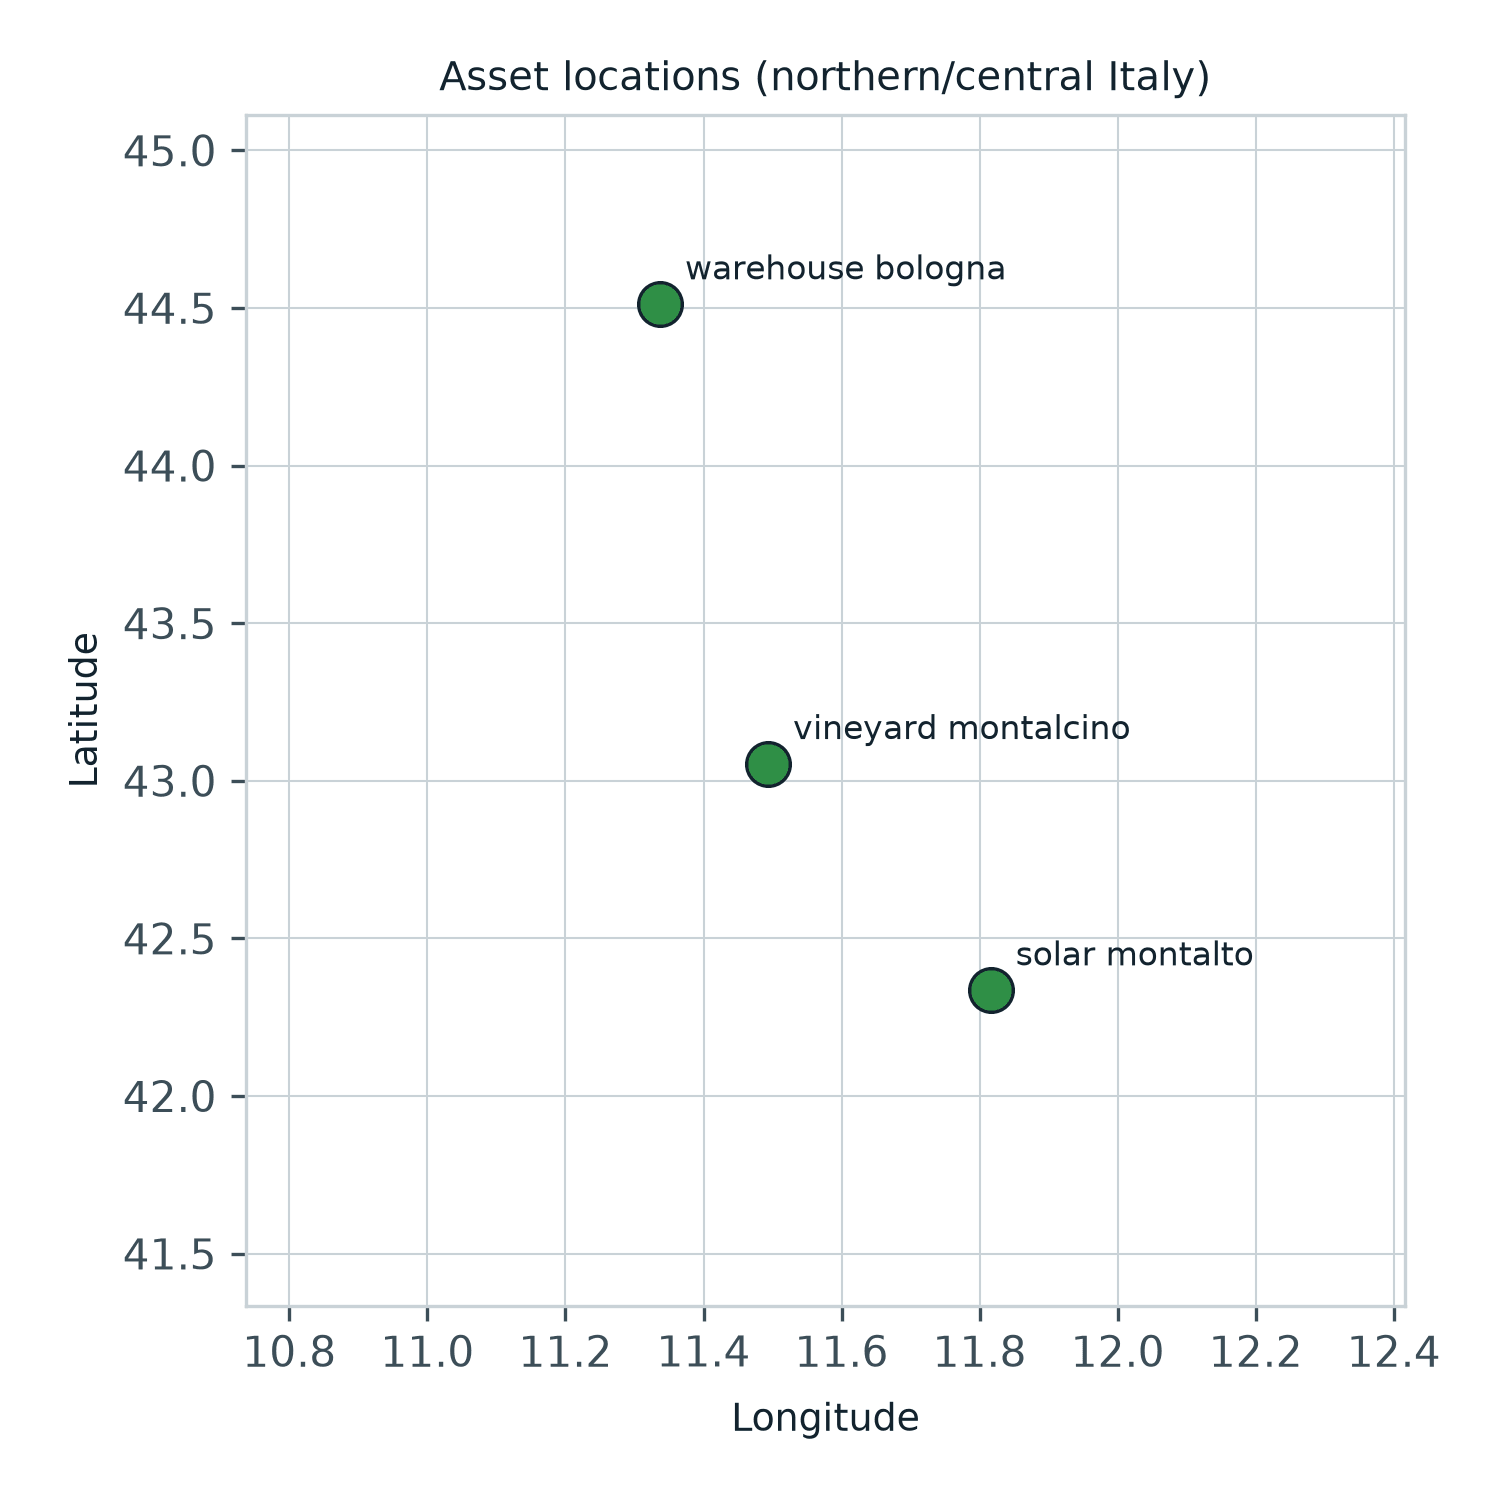
- Assets
- Warehouse, solar farm, vineyard
- Places
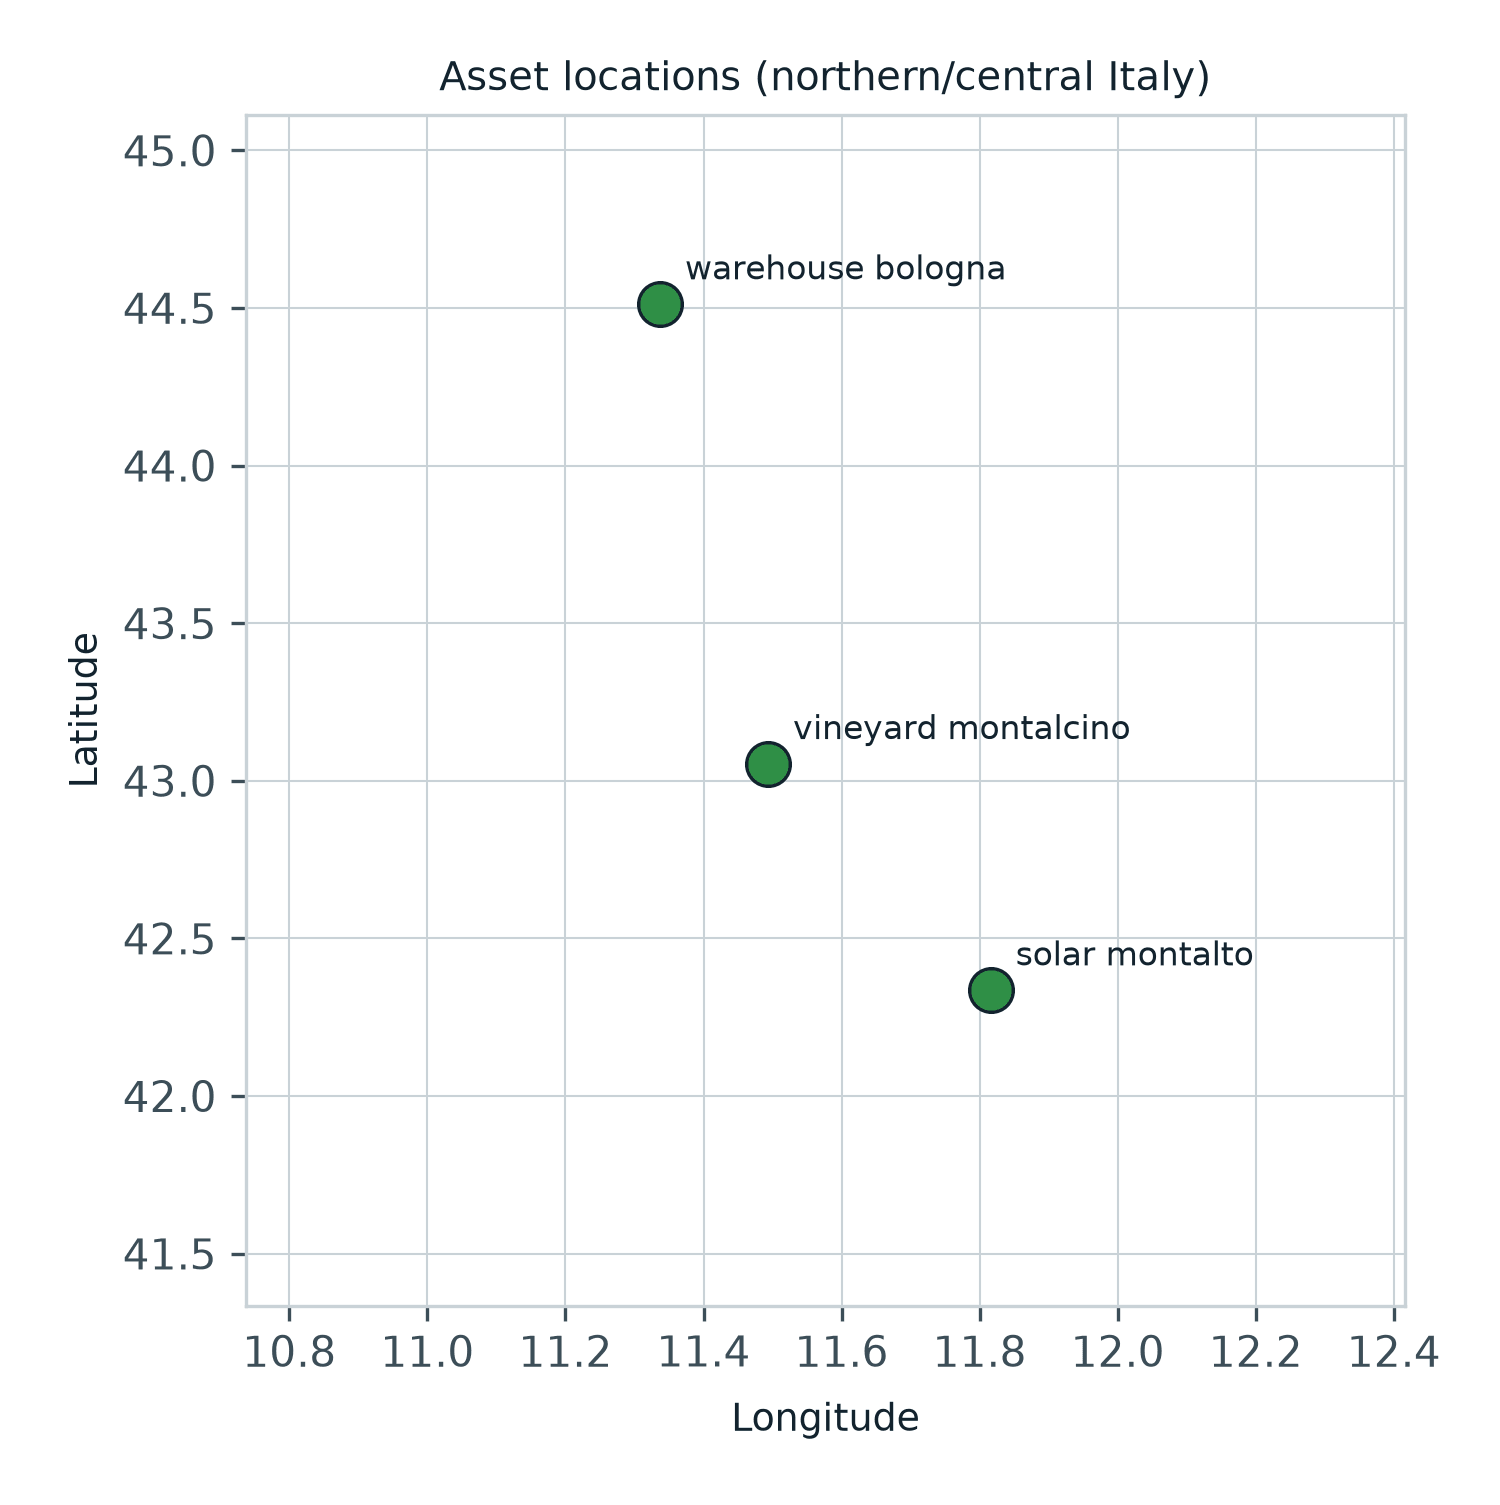
- Bologna, Montalto di Castro, Montalcino
- Last looks
- 26 to 29 Sep 2026
- Baseline
- Each asset's own previous three years
- Status
- 3 of 3 within range
- Product
- Asset status check
The problem
A portfolio team holding hundreds of assets needs to know which ones changed since the last look, so that site visits go where they are needed.
What we did
Each asset read from Sentinel-2 over a recent window and set against the same window in each of its own previous three years, with radar printed beside it.
The result
All three assets read within their own quiet range, a second read on another day gave the same figures, and none of them needs a visit this round.
Overview
Portfolios are mixed. An insurer's or a lender's book holds warehouses next to farmland next to energy sites, and each kind of ground behaves differently from one month to the next. A rule that works for a roof flags every vineyard at harvest, and a rule tuned for a vineyard misses a roof that has come off.
This case reads three assets in Italy with the asset status check: a warehouse near Bologna, a solar farm near Montalto di Castro and a vineyard near Montalcino. The footprints were drawn by us at real locations. It is one of our own test cases.
The challenge
A portfolio manager needs one question answered across the whole book: which assets changed beyond what is normal for them. The answer decides where the site visits and the follow-up calls go this quarter.
The difficulty is the word normal. A solar farm should read flat, a warehouse almost flat, a vineyard anything but. Judged by one threshold, the vineyard is either always flagged or the warehouse is never flagged.
What we did
Each asset was read from Copernicus Sentinel-2 over a recent window before and after the reading date. The share of its ground that moved was then compared with the same windows in each of the asset's own previous three years. That range is the asset's quiet range: how much this ground usually changes at this time of year.
An asset reads within its quiet range or above it. Sentinel-1 radar is printed beside each read as a second line that does not depend on cloud. The read was then repeated on a different day.
What the record showed
| Asset | Status | Last clear look |
|---|---|---|
| Warehouse, Bologna | Within its quiet range | 29 September 2026 |
| Solar farm, Montalto di Castro | Within its quiet range | 26 September 2026 |
| Vineyard, Montalcino | Within its quiet range | 26 September 2026 |
All three assets read within their own quiet range. The repeat read on a different day returned the same three figures to four decimal places.
The vineyard is the useful one to look at. Late September is harvest in Montalcino, when the canopy is changing week by week. Read against its own Septembers, it sat where it usually sits.
What it means
For a portfolio team the record dates each look and states each asset's own range, so a status means the same thing on a roof and on a vine. These three can wait, and the visits go where something moved.
The same check reads up to 60 assets in one run, from a GeoJSON file, a shapefile, a KML or a CSV of points with your own references. Each asset keeps its history in the register, so the next run updates the same rows rather than starting again.
Run this on your own ground
Draw an area of interest, pick the dates, and the same analysis runs against the archive over your sites.
References
- Axine Labs (2026). Dated records for claims and portfolios. Three live runs, section 3.
- European Space Agency. Copernicus Sentinel-2 and Sentinel-1 missions. sentinels.copernicus.eu
More case studies
Storm Johannes: which stands to visit first, ranked from open imagery
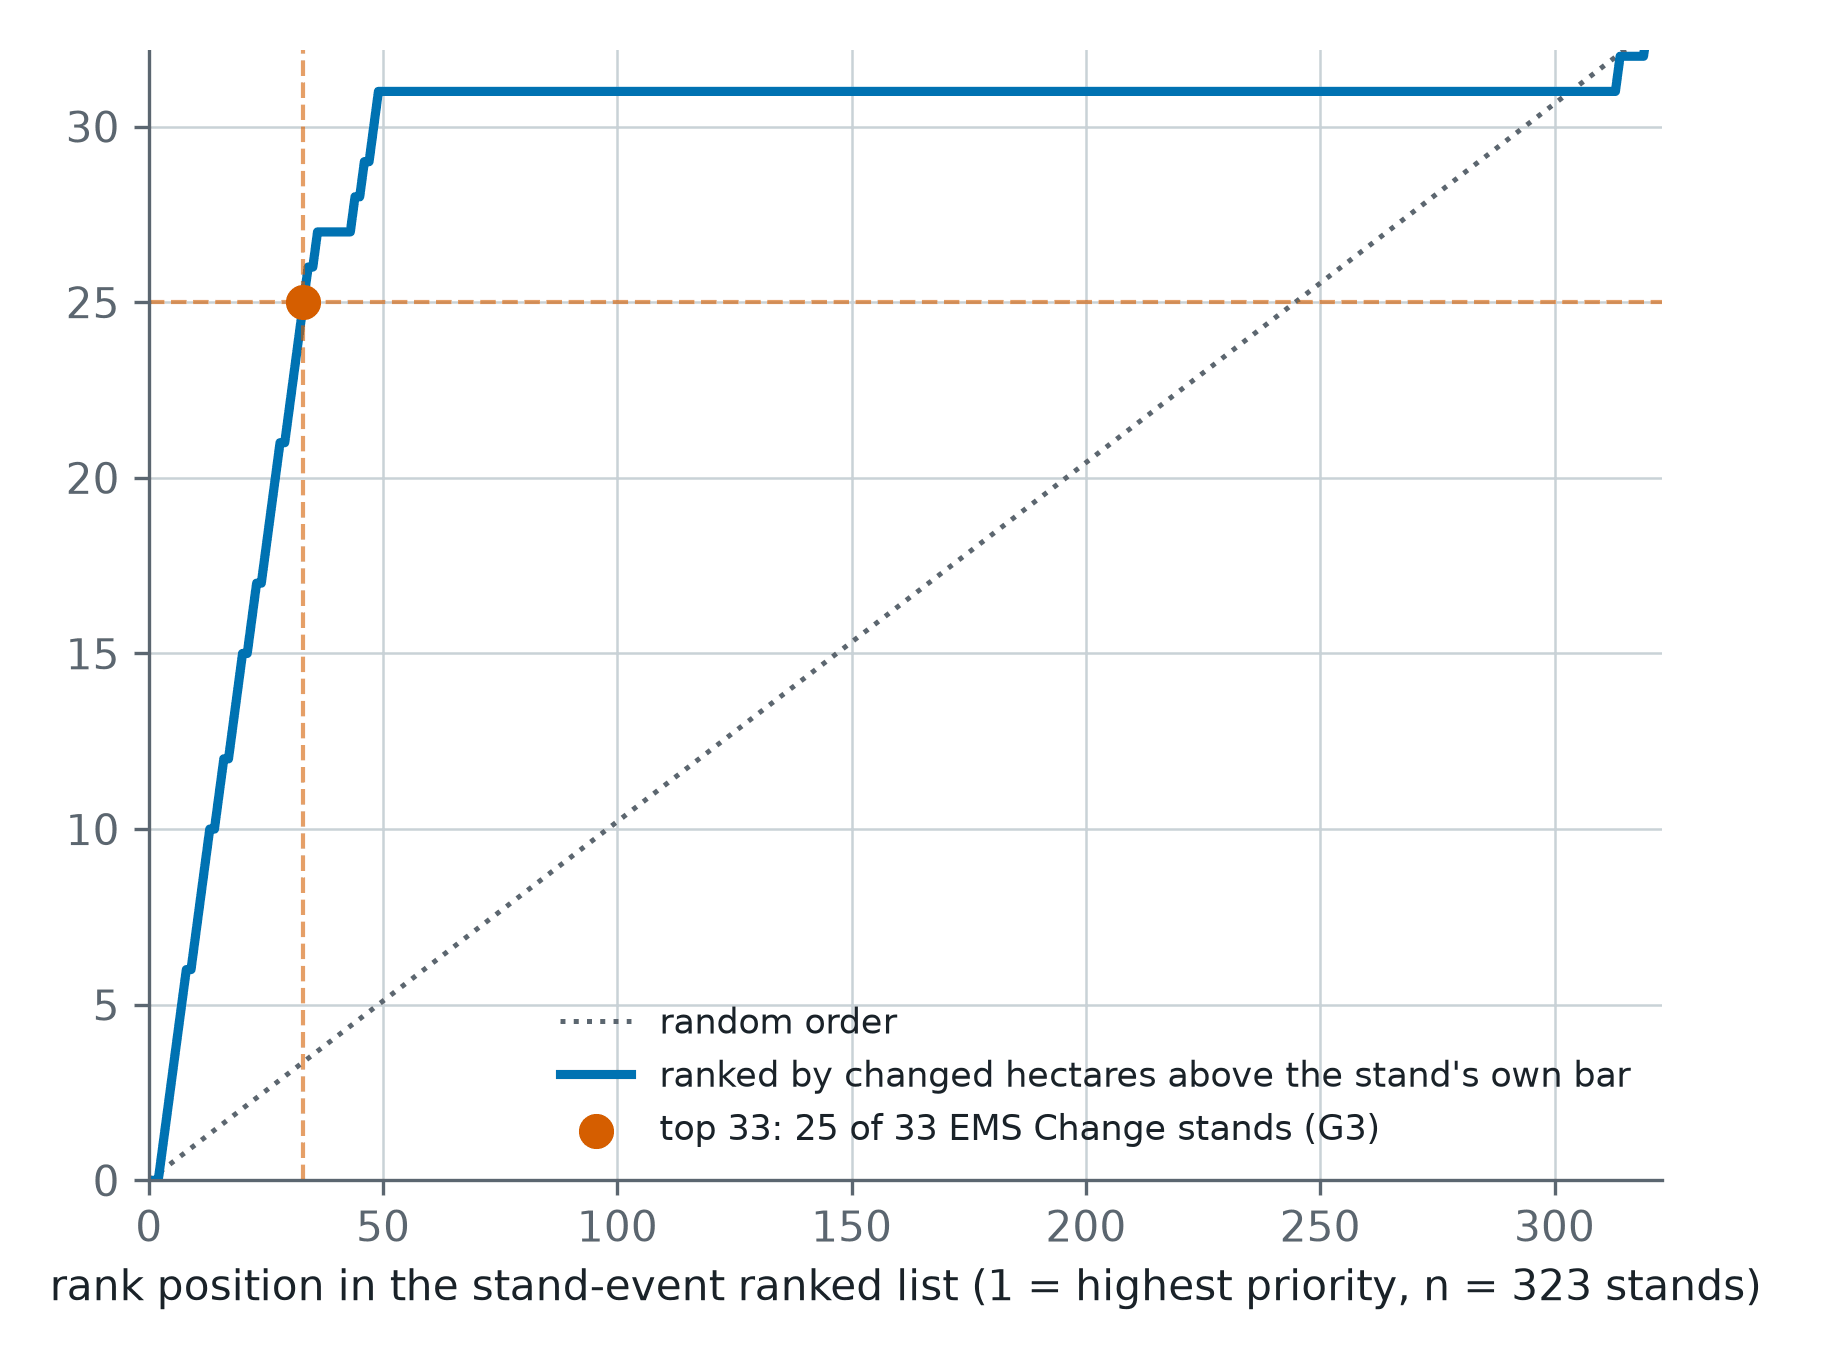
After the December 2025 storm in central Sweden, 323 test stands were ranked from Sentinel-1 and Sentinel-2. Of the 33 the storm had changed, 25 sat in the top 33 of the list. Random order would have put three or four there.
Forty-three seasons of one Nebraska pivot, and its first zone map
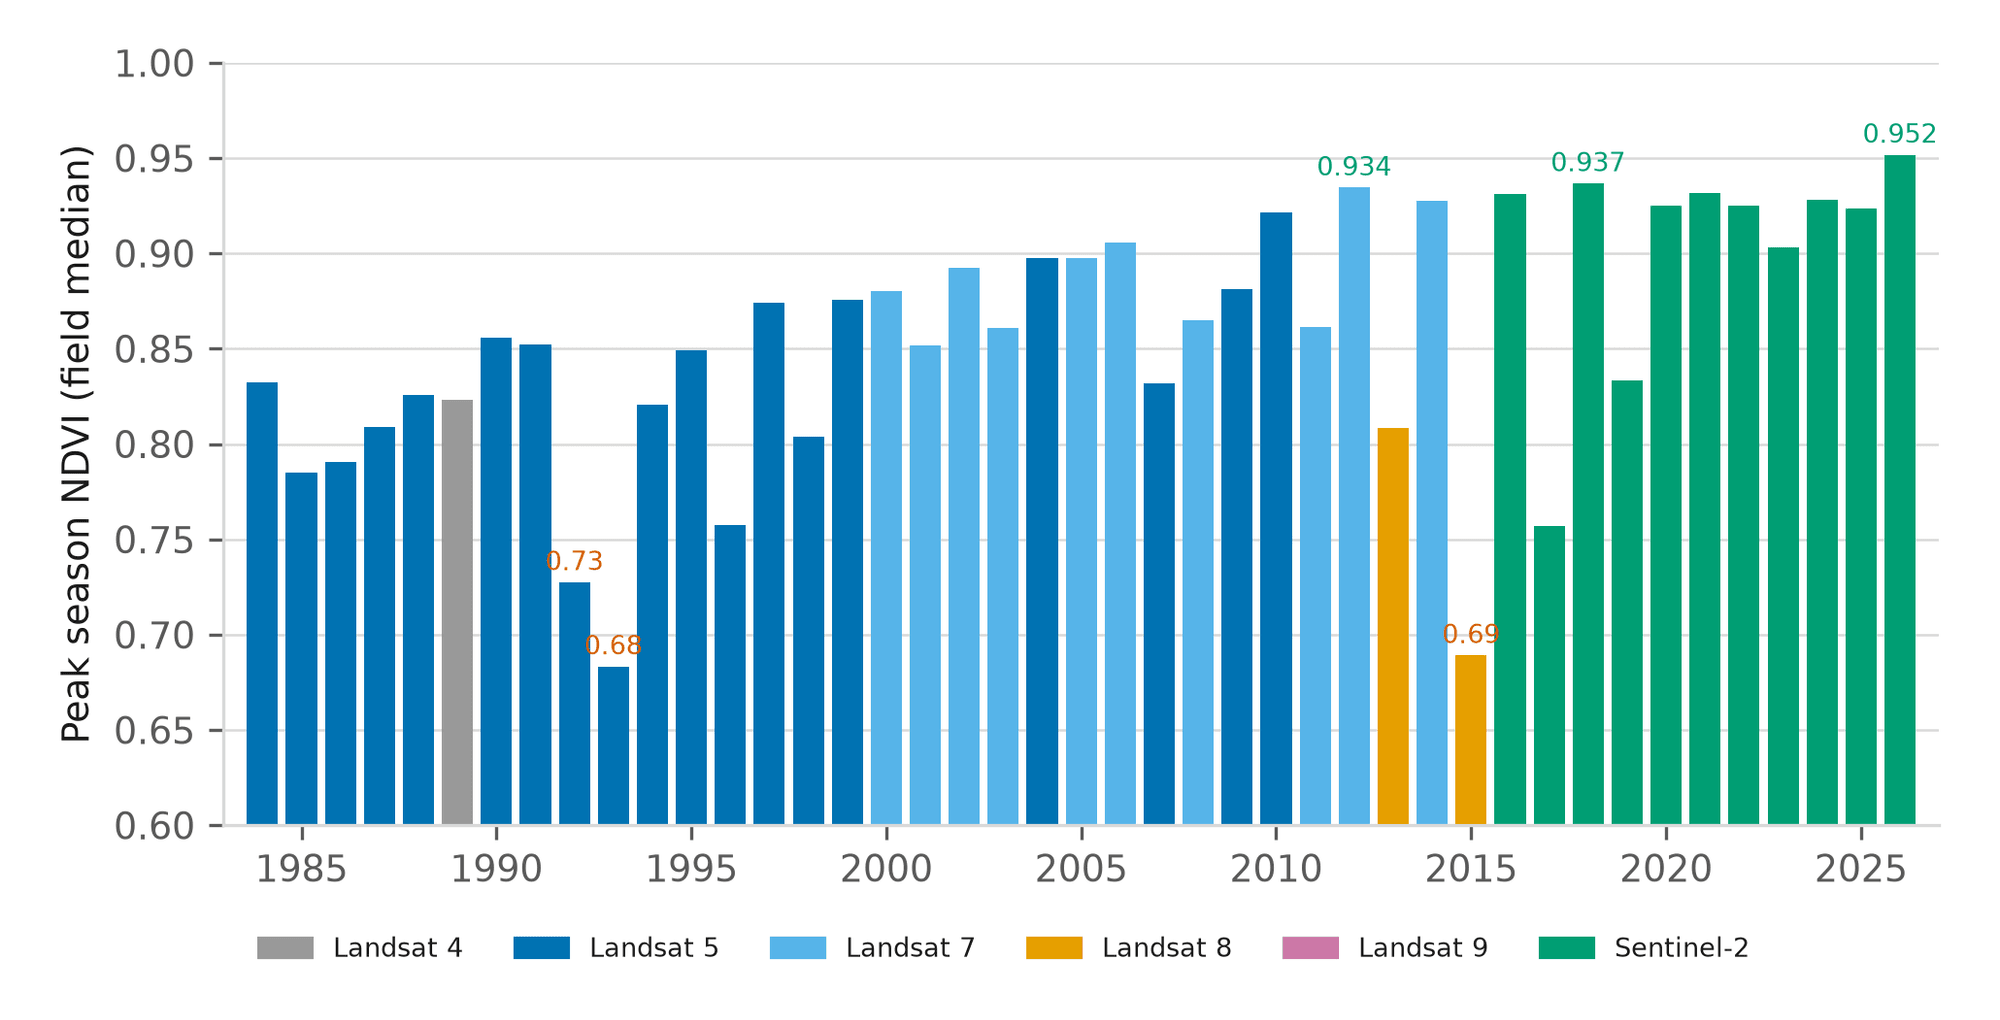
Before driving out, an agronomist wants to know whether this season is unusual for this field, not for the county. One centre pivot near Seward has a reading for every season from 1984 to 2026, and 2026 is the highest of them.
A Kansas season on one page, and the next two weeks of disease pressure
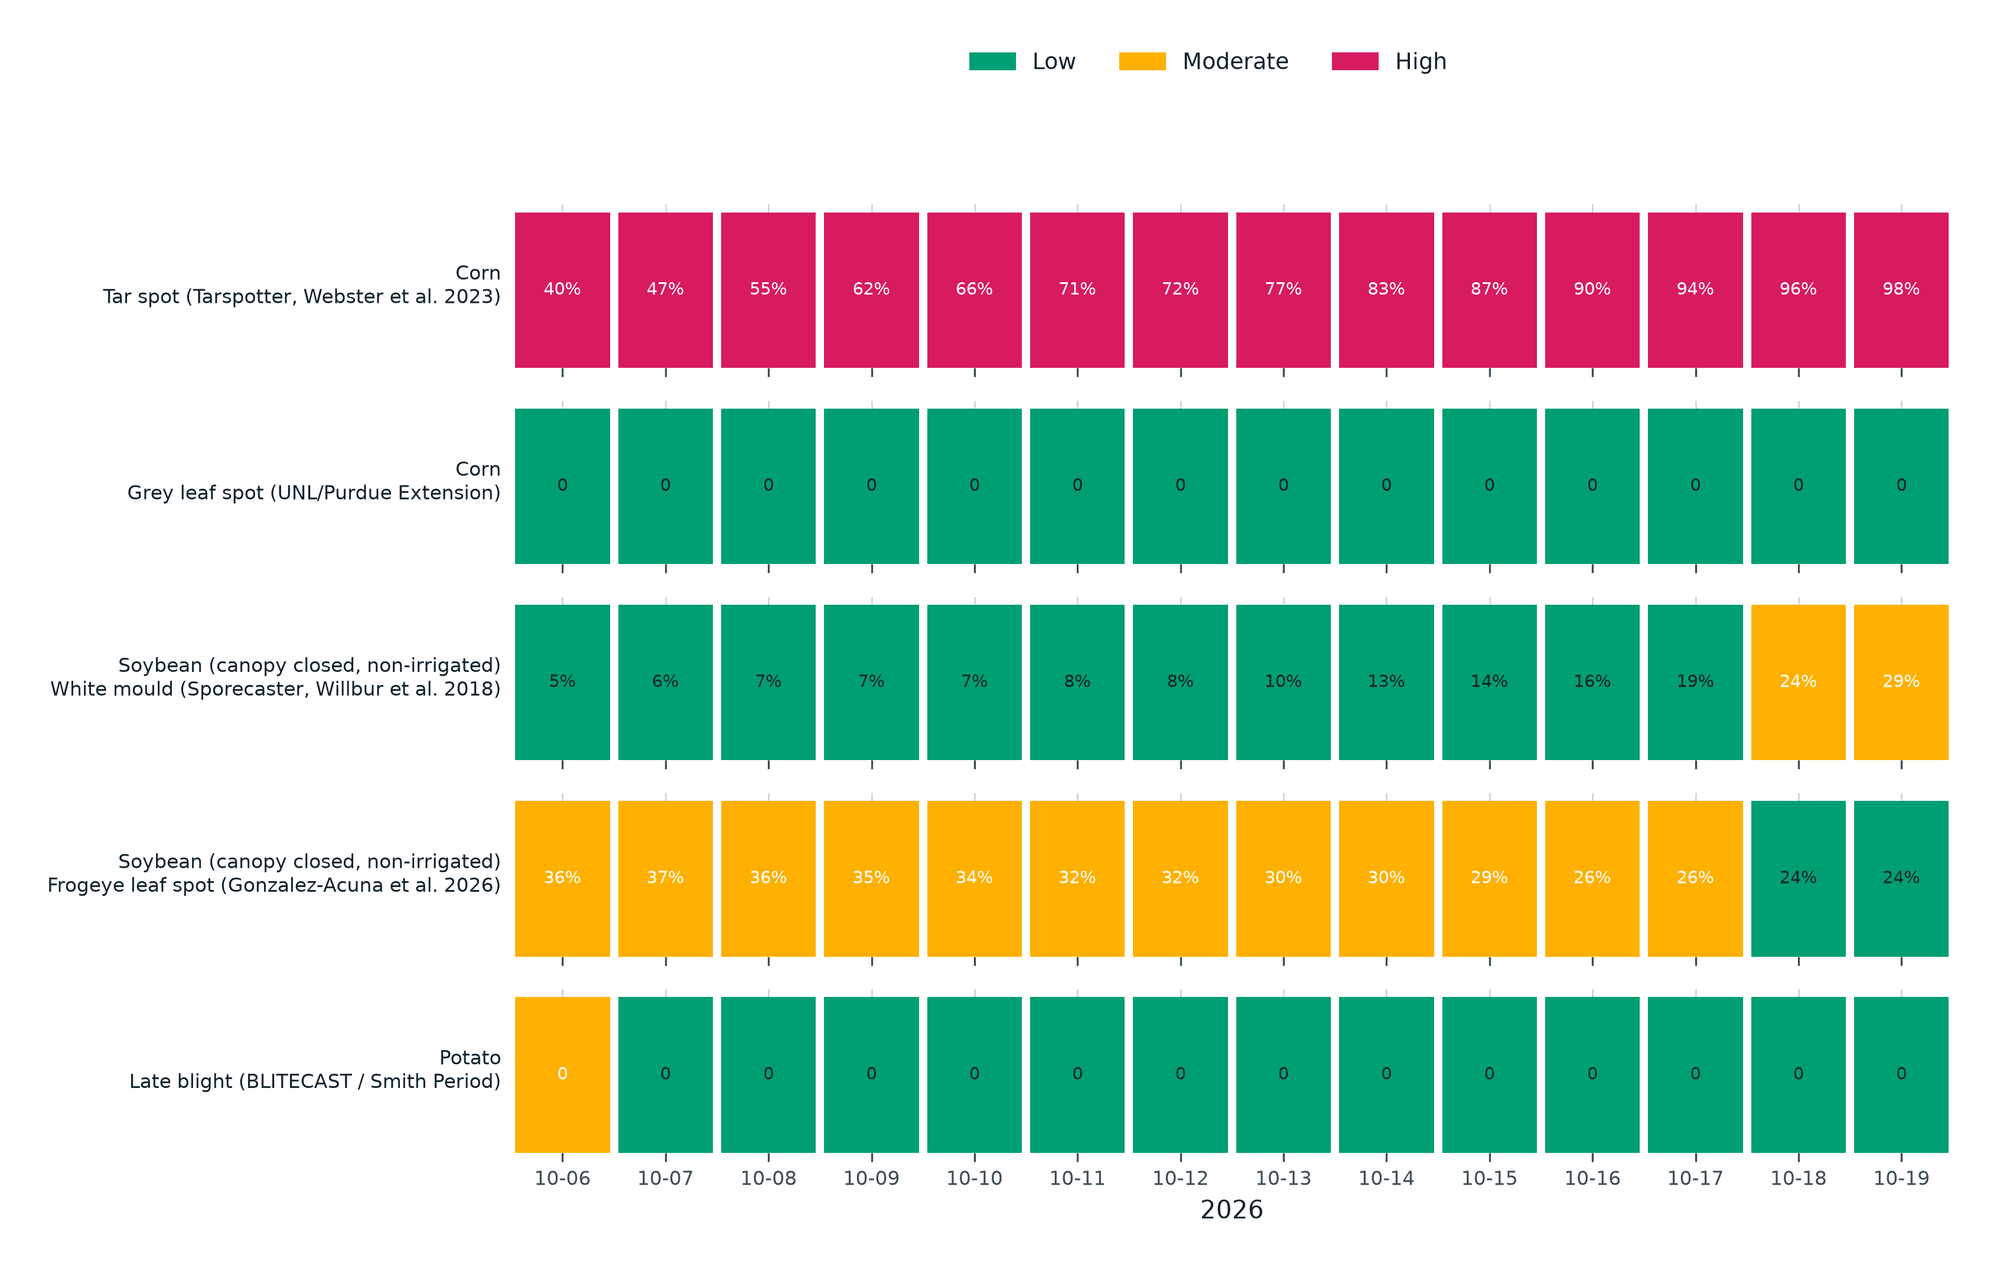
A 61-hectare corn pivot in western Kansas, 184 days into the 2026 season: 53 days at or above 35 °C against a normal of 27.8, more heat units than usual, and five published disease models run on the field's own forecast.