
Flood extent and risk
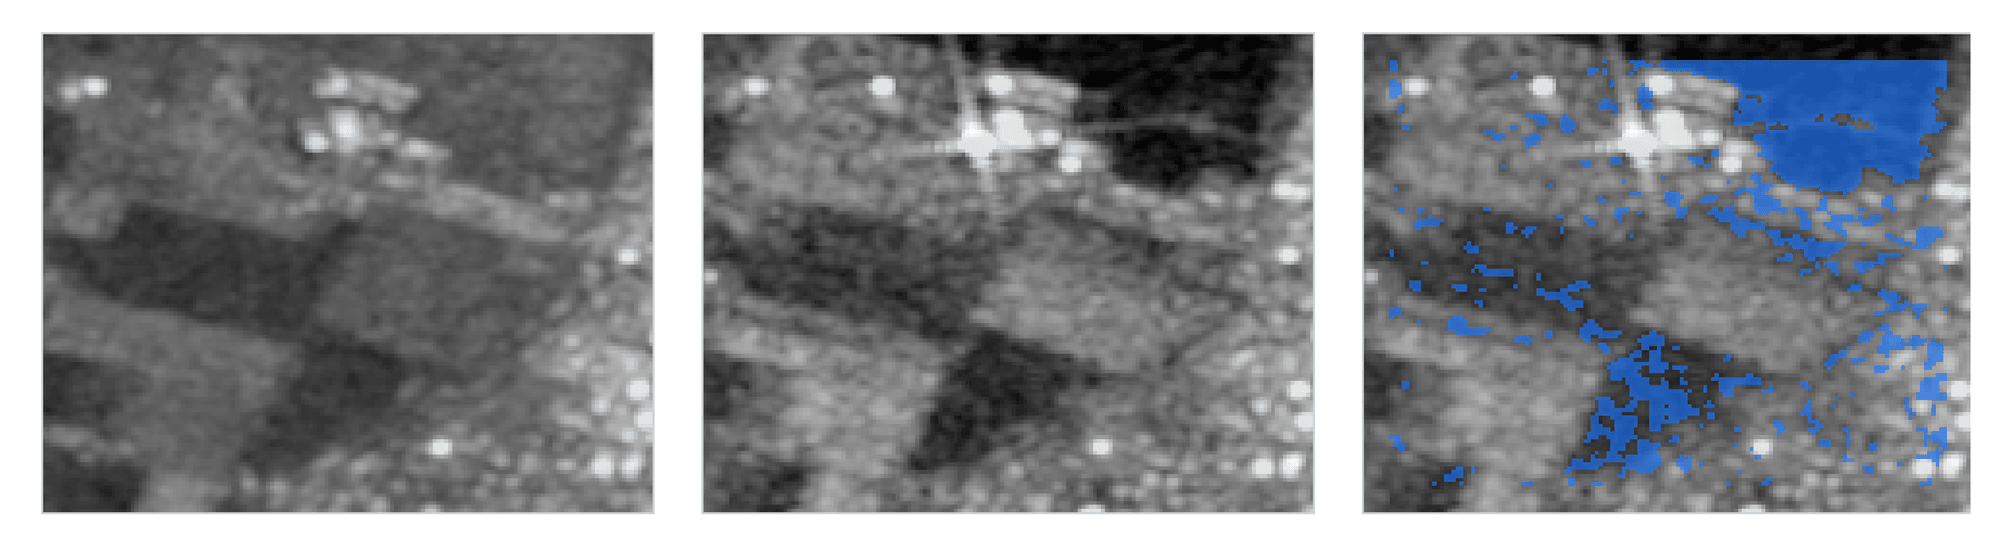
The record maps flood extent from Sentinel-1 radar, which sees through the cloud that covers most floods. Upload your parcels or assets and it lists which ones sat in flooded ground, with a terrain exposure class for each.
For claims teams settling flood losses, underwriters and risk managers looking at a territory, and parametric programmes that need a dated event layer.
- Area
- Up to 3,000 km²
- Primary source
- Sentinel-1 radar
- Delivered as
- PDF, GeoTIFF, GeoJSON, KML, shapefile
01 · The order
What you send, and what comes back
You send
- The area and the date of the flood
- Your parcels or assets, if you want them listed
You receive
- The flood extent as a raster and a vector layer, with hectares flooded
- A terrain exposure layer in four classes
- A table of the parcels or assets that sat in flooded ground
- A Sentinel-2 check where a clear optical scene exists
- Before and after images, the scene list and the sources in the PDF
02 · How it is read
From the open archive to the record
Public sources
- 01
The method follows UN-SPIDER’s recommended practice for radar flood mapping, comparing each flood scene with a reference from before the event.
- 02
Permanent water from the JRC Global Surface Water record and steep ground from the Copernicus DEM are taken out, so rivers, lakes and hillside shadow are not counted.
- 03
The exposure class comes from terrain. It is a class for the ground, not a return period or a depth.
03 · The record behind it
What it has been measured against
Each figure is printed with its denominator and scope in the paper it links to.
- 23 ha
- read newly flooded on a 114 ha parcel at Conselice by the same radar method, run inside a claim record
More in Insurance and finance
Claims validation
A dated before and after record of a claim parcel, read from the scenes on either side of the date of loss.
Asset status check
Each asset in a book read against its own previous three years, with the ones that changed beyond their usual range marked.
Construction progress
A monthly built share for a construction site, with a dated satellite image beside every month.
Damage mapping
A before and after read of one area after one event: changed ground, built-up damage candidates, and screens over water.
Climate risk scan
Seven hazard classes for every asset in a book, from long weather records and public hazard archives.
Portfolio monitoring
One view of a registered book: the latest flood, fire, forest and site records for each asset, with changed assets first.
Send us ten closed claims
Send ten claims from last season that are already settled. We re-read them at no charge, so you can set the record beside what your adjusters found.