
A Kansas season on one page, and the next two weeks of disease pressure
A 61-hectare corn pivot in western Kansas, 184 days into the 2026 season: 53 days at or above 35 °C against a normal of 27.8, more heat units than usual, and five published disease models run on the field's own forecast.
- Field
- Corn pivot, western Kansas
- Area
- 61 ha
- Season read
- 1 Apr to 1 Oct 2026
- Degree days
- 2,428.6 vs 2,218.8 normal
- Heat days
- 53 vs 27.8 normal
- Frost days
- 0 vs 2.5 normal
- Disease forecast
- 6 to 19 Oct 2026
- Products
- Agroclimatic report, disease risk
The problem
An agronomy lead or a crop insurer's analyst wants the season on one page, and a two-week view of disease pressure before deciding what to scout.
What we did
The season against the field's own 10-year normal from ERA5 reanalysis, Sentinel-2 for the crop's calendar, and published disease models on the field's forecast.
The result
A hot season with more heat units than usual, soil drier than normal at both depths, and a daily risk class for each disease for the next 14 days.
Overview
A 61-hectare corn pivot in western Kansas is one of the test fields behind the agriculture products. On 6 October 2026, 184 days into the season, we ran two of them on it: the agroclimatic report, which puts the season on one page against the field's own normal, and the disease risk forecast, which runs published disease models on the field's own weather forecast.
This is one of our own test cases.
The challenge
An agronomy lead deciding what to scout, or a crop insurer's analyst looking at a claim, wants two things quickly. How has this season run on this field against what is normal for it. And what is the disease pressure for the next two weeks.
Both answers usually come from separate places: a weather service, an extension bulletin, a model on a university website. Each is read for a point that is not the field.
What we did
The season brief reads the field's weather from ERA5 and ERA5-Land reanalysis and sets each figure against a 10-year normal for the same days of the season. Growing degree days, rain, frost days and heat days follow published definitions. The crop's calendar, from green-up through peak to senescence, comes from 16 Sentinel-2 looks over the field.
The disease panel runs five published models on the field's own 14-day forecast and the trailing weather each one needs: two for corn, two for soybean and one for potato. Soybean and potato are run on this corn field as an illustration of what the panel shows for those crops.
What the record showed
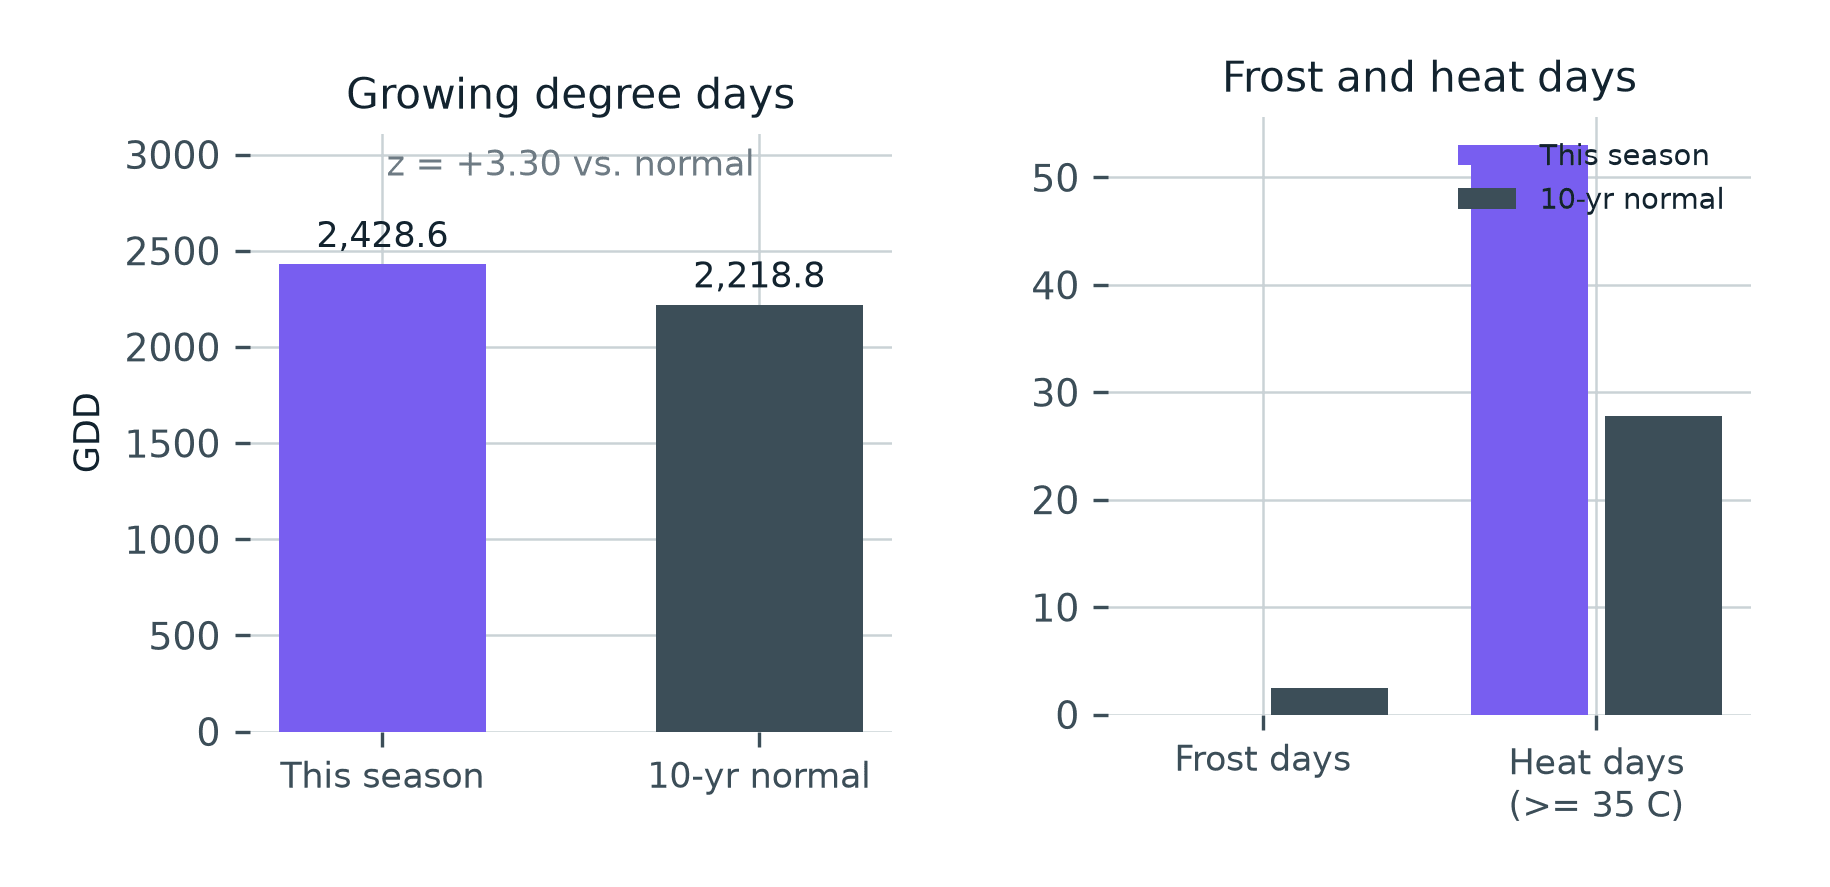
| This season | 10-year normal | |
|---|---|---|
| Growing degree days | 2,428.6 | 2,218.8 |
| Days at or above 35 °C | 53 | 27.8 |
| Frost days | 0 | 2.5 |
| Soil moisture, surface and root zone | drier than normal | |
| Green-up, peak, senescence | 19 May, 8 July, 21 September |
It was a hot season. The field counted 53 days at or above 35 °C against a normal of 27.8, ran ahead on heat units, and had no frost days. Soil moisture sat below normal at the surface and at root depth through the season.
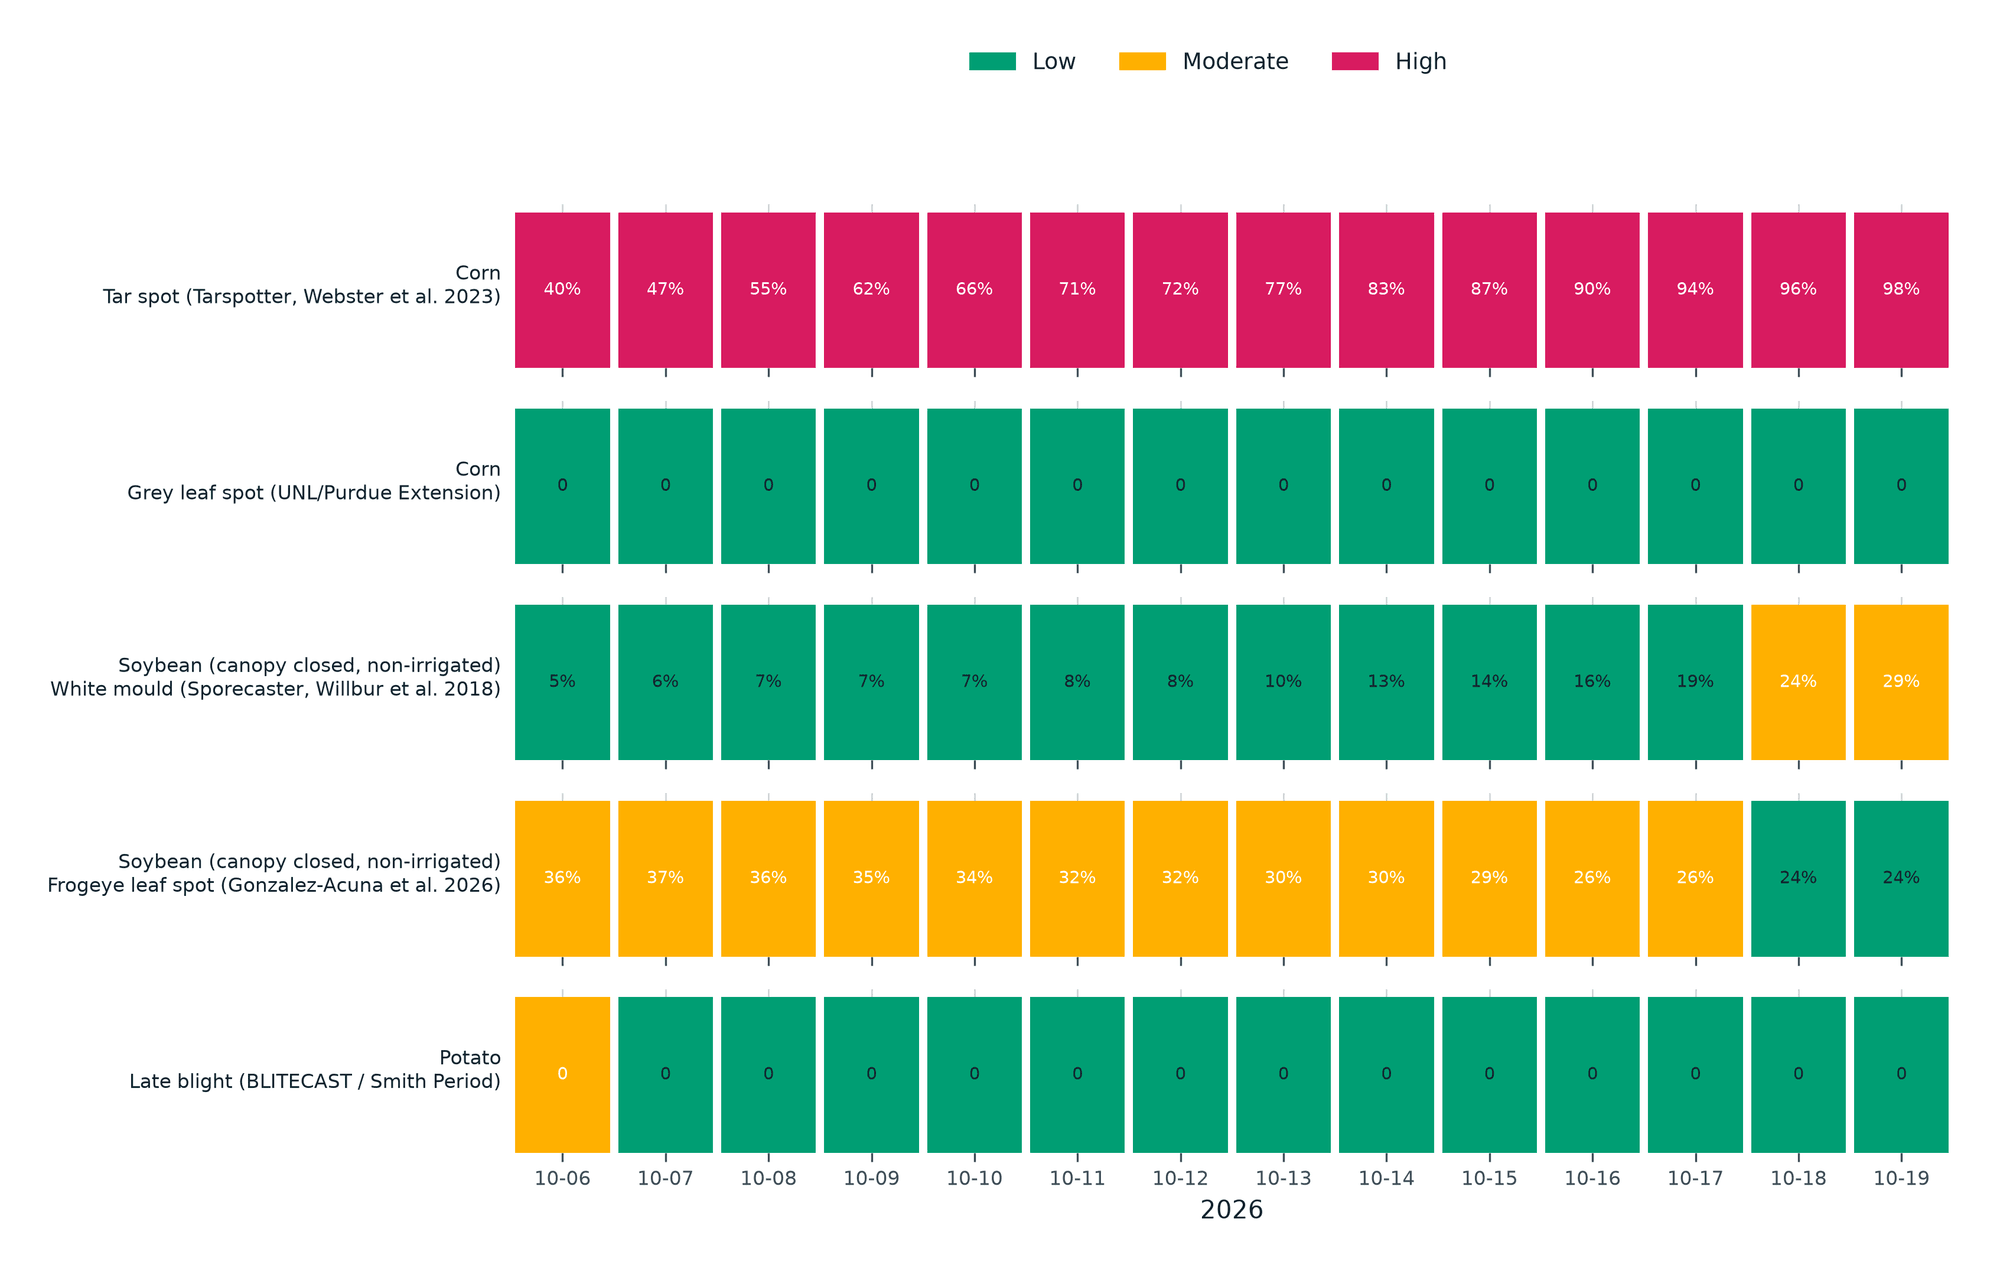
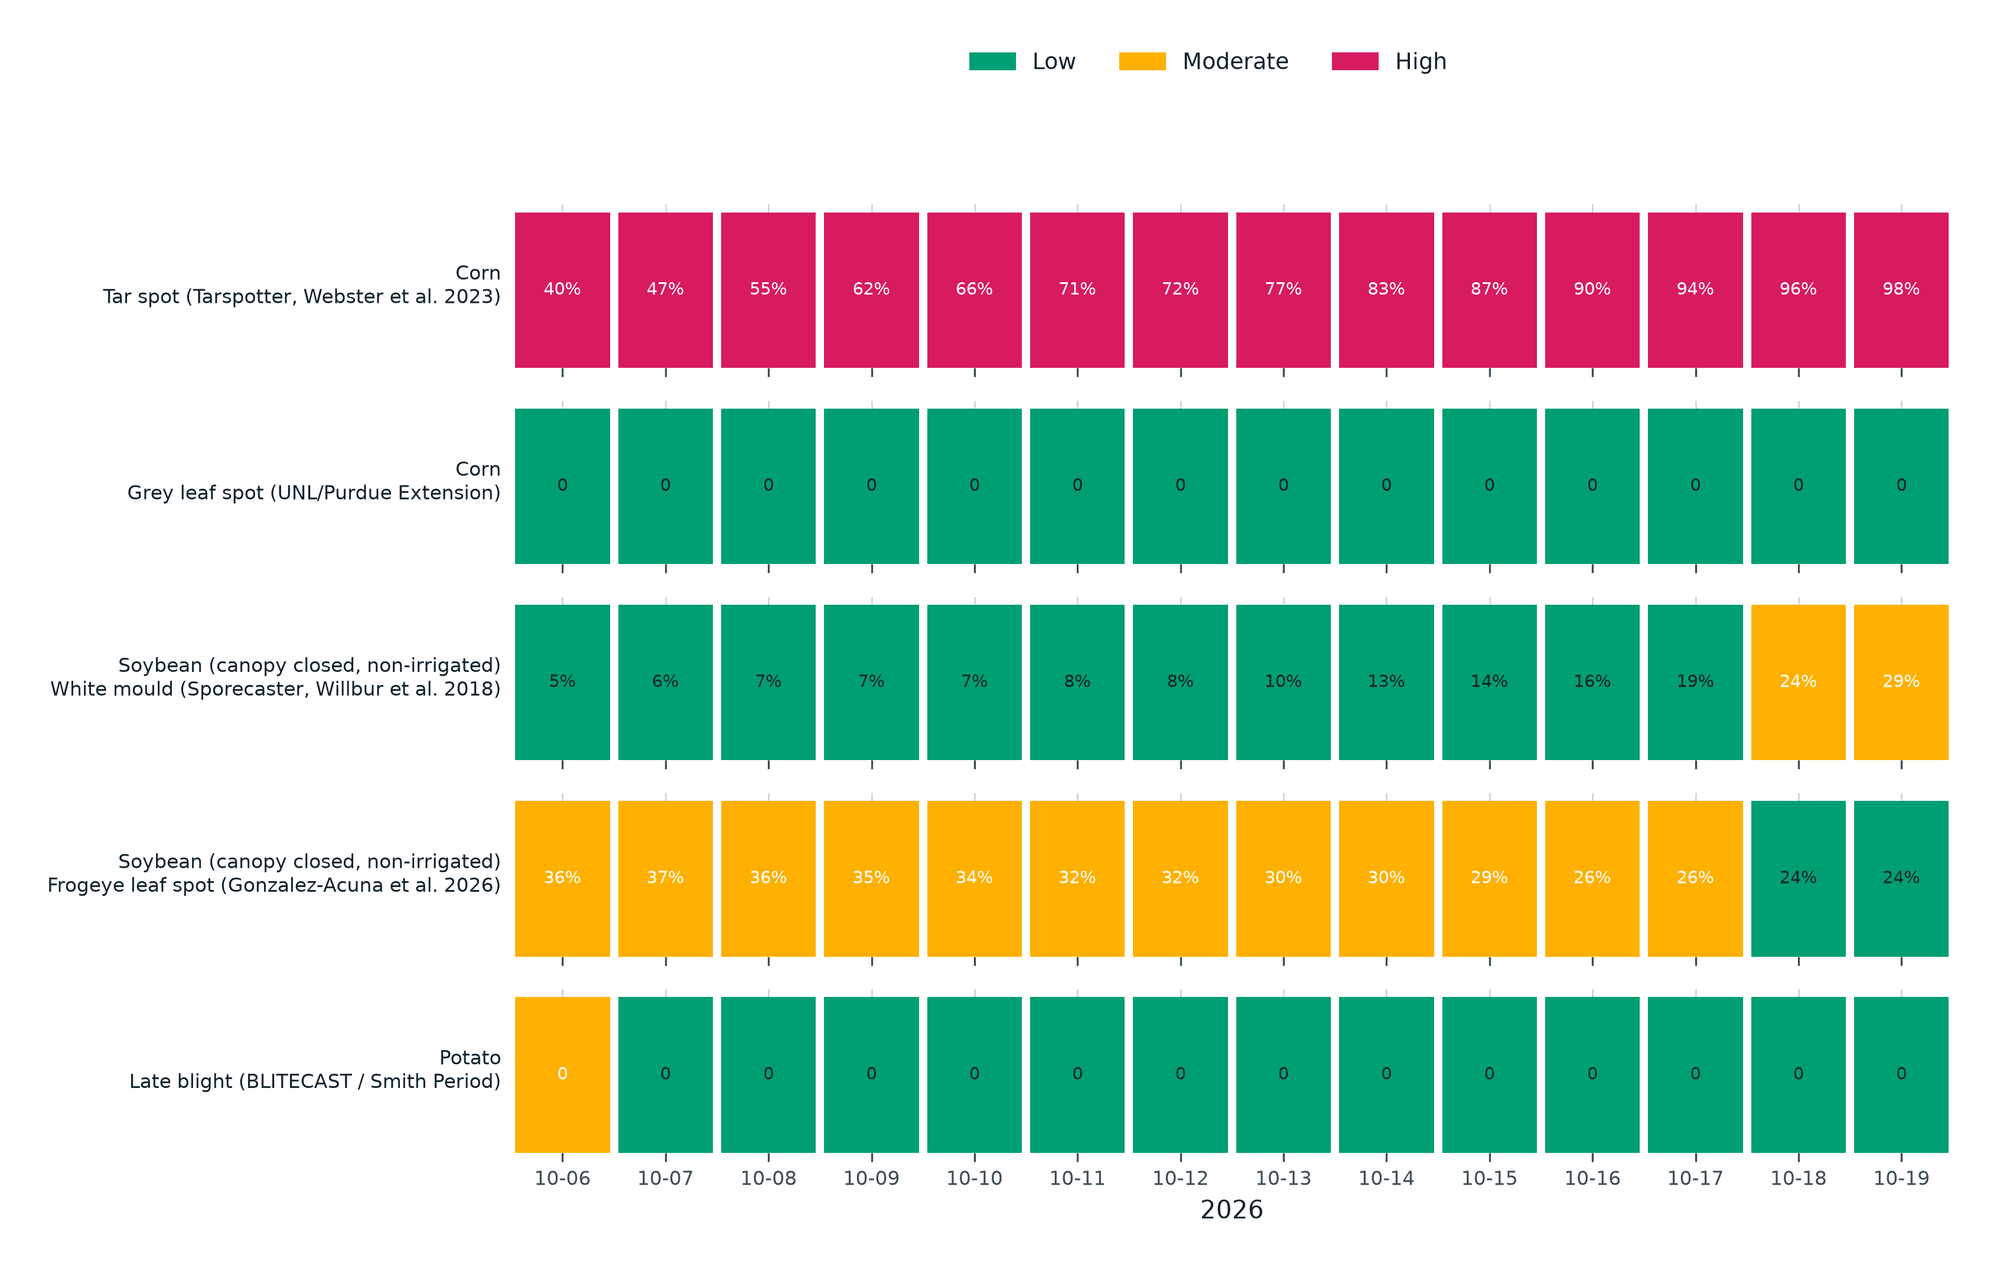
The disease panel gives each day a low, moderate or high class from each model's own published action threshold, with the model's figure in each cell. Grey leaf spot on the corn stays low for all fourteen days. The soybean and potato rows show how the same panel reads for those crops on this field's weather.
What it means
For an agronomist the brief is a dated page to bring to the grower, and the panel is a short list of what to scout and when. For a claims analyst the brief puts a season's heat, frost and soil moisture beside a claim, with the normal it was measured against.
Every model in the panel is a published one and is cited in the report, so an agronomist can open the paper behind any class. The report states the number of years each normal rests on.
Run this on your own ground
Draw an area of interest, pick the dates, and the same analysis runs against the archive over your sites.
References
- Axine Labs (2026). Weather, soil moisture and disease risk for a field: published models run on open data. The season brief and disease models.
- Muñoz-Sabater J. et al. (2021). ERA5-Land: a state-of-the-art global reanalysis dataset for land applications. Earth System Science Data 13, 4349 to 4383. doi.org/10.5194/essd-13-4349-2021
- McMaster G. S., Wilhelm W. W. (1997). Growing degree-days: one equation, two interpretations. Agricultural and Forest Meteorology 87, 291 to 300. doi.org/10.1016/S0168-1923(97)00027-0
- Webster R. W. et al. (2023), the Tarspotter model. Scientific Reports 13, 17064. doi.org/10.1038/s41598-023-44338-6
- Willbur J. F. et al. (2018). Weather-based models for assessing the risk of Sclerotinia sclerotiorum apothecial presence in soybean fields. Plant Disease 102, 73 to 84. doi.org/10.1094/PDIS-04-17-0504-RE
More case studies
Storm Johannes: which stands to visit first, ranked from open imagery
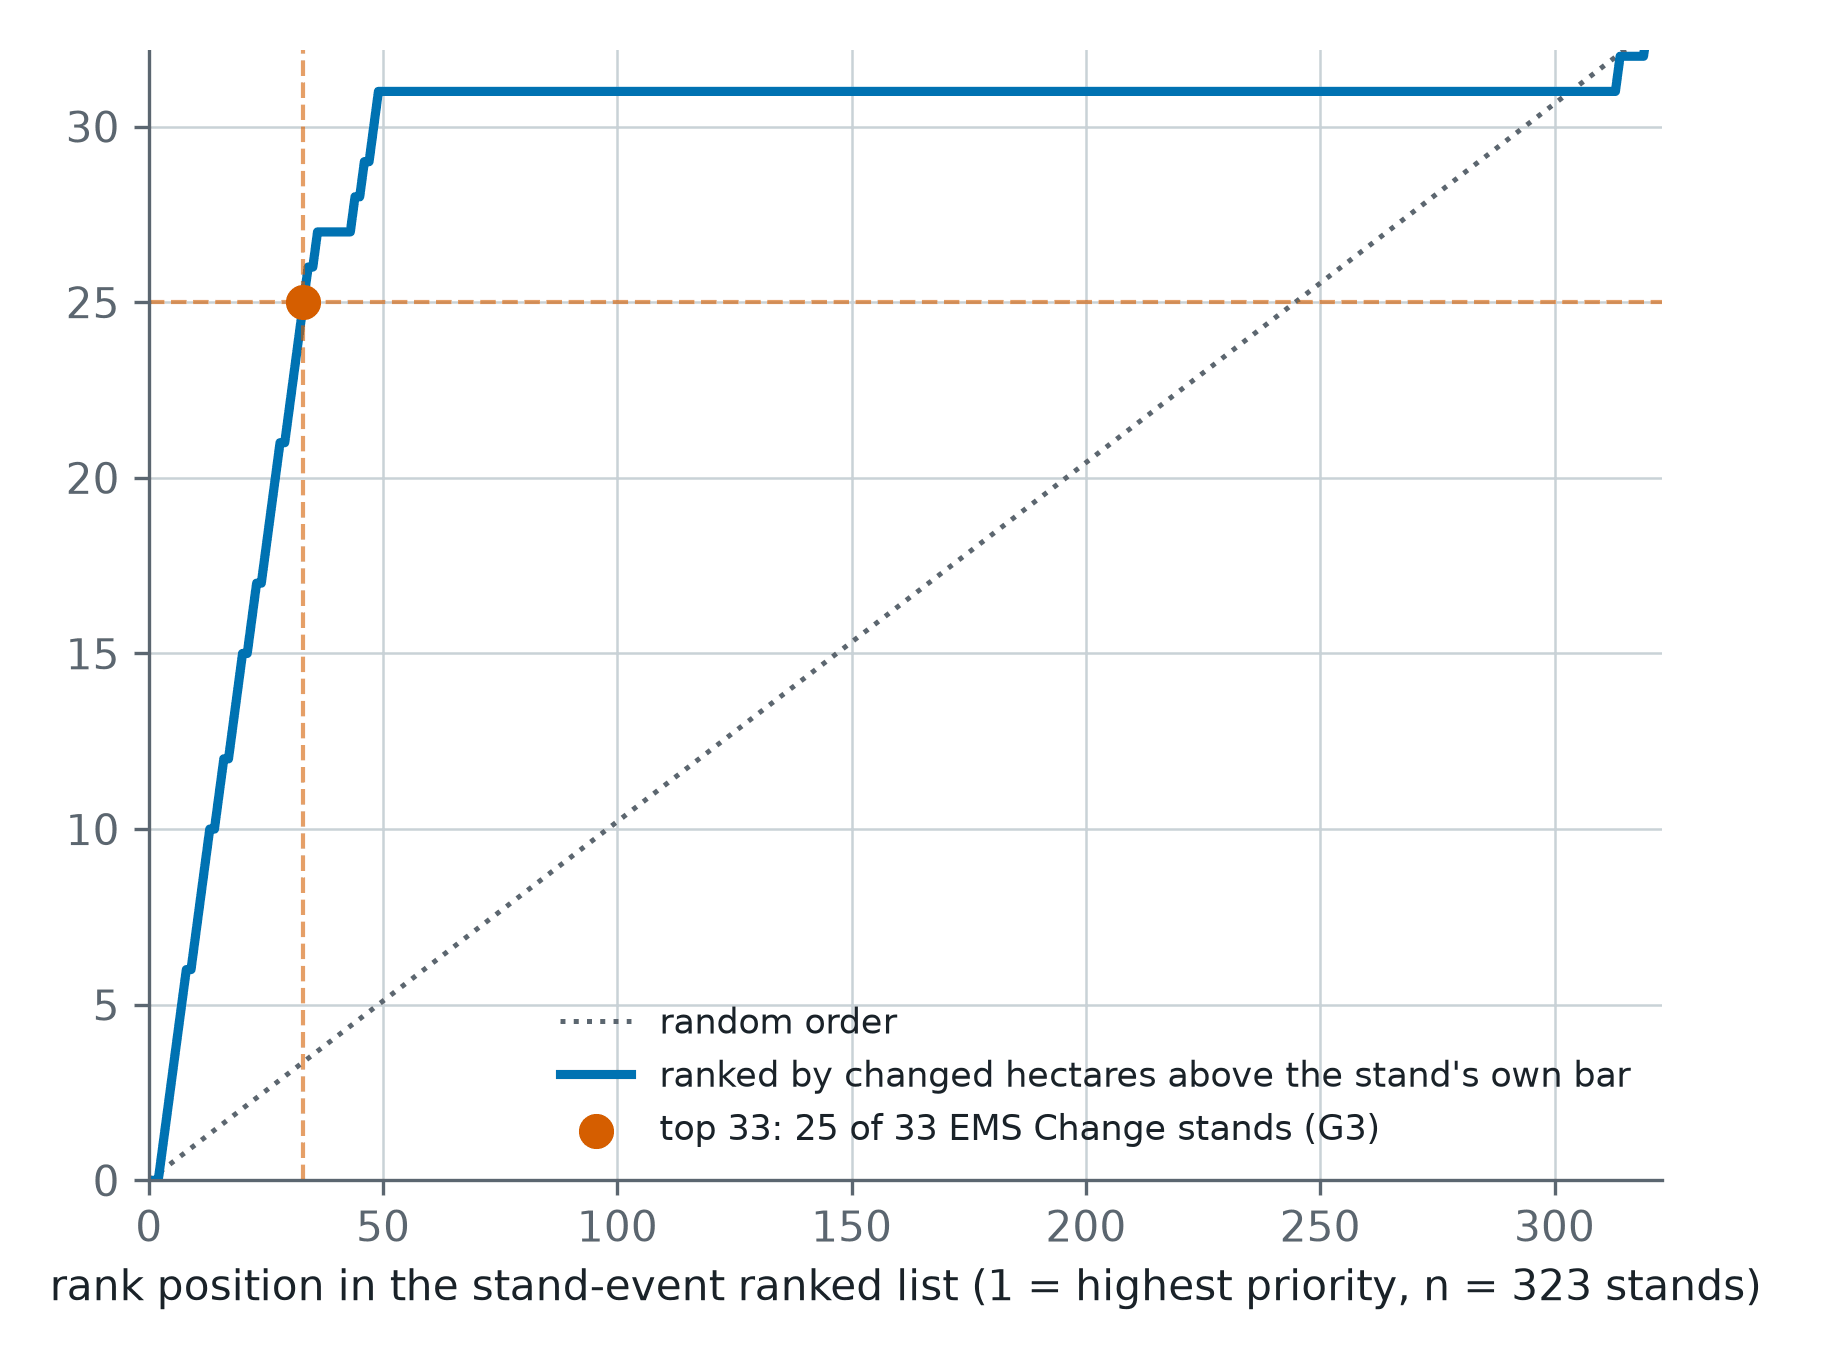
After the December 2025 storm in central Sweden, 323 test stands were ranked from Sentinel-1 and Sentinel-2. Of the 33 the storm had changed, 25 sat in the top 33 of the list. Random order would have put three or four there.
Forty-three seasons of one Nebraska pivot, and its first zone map
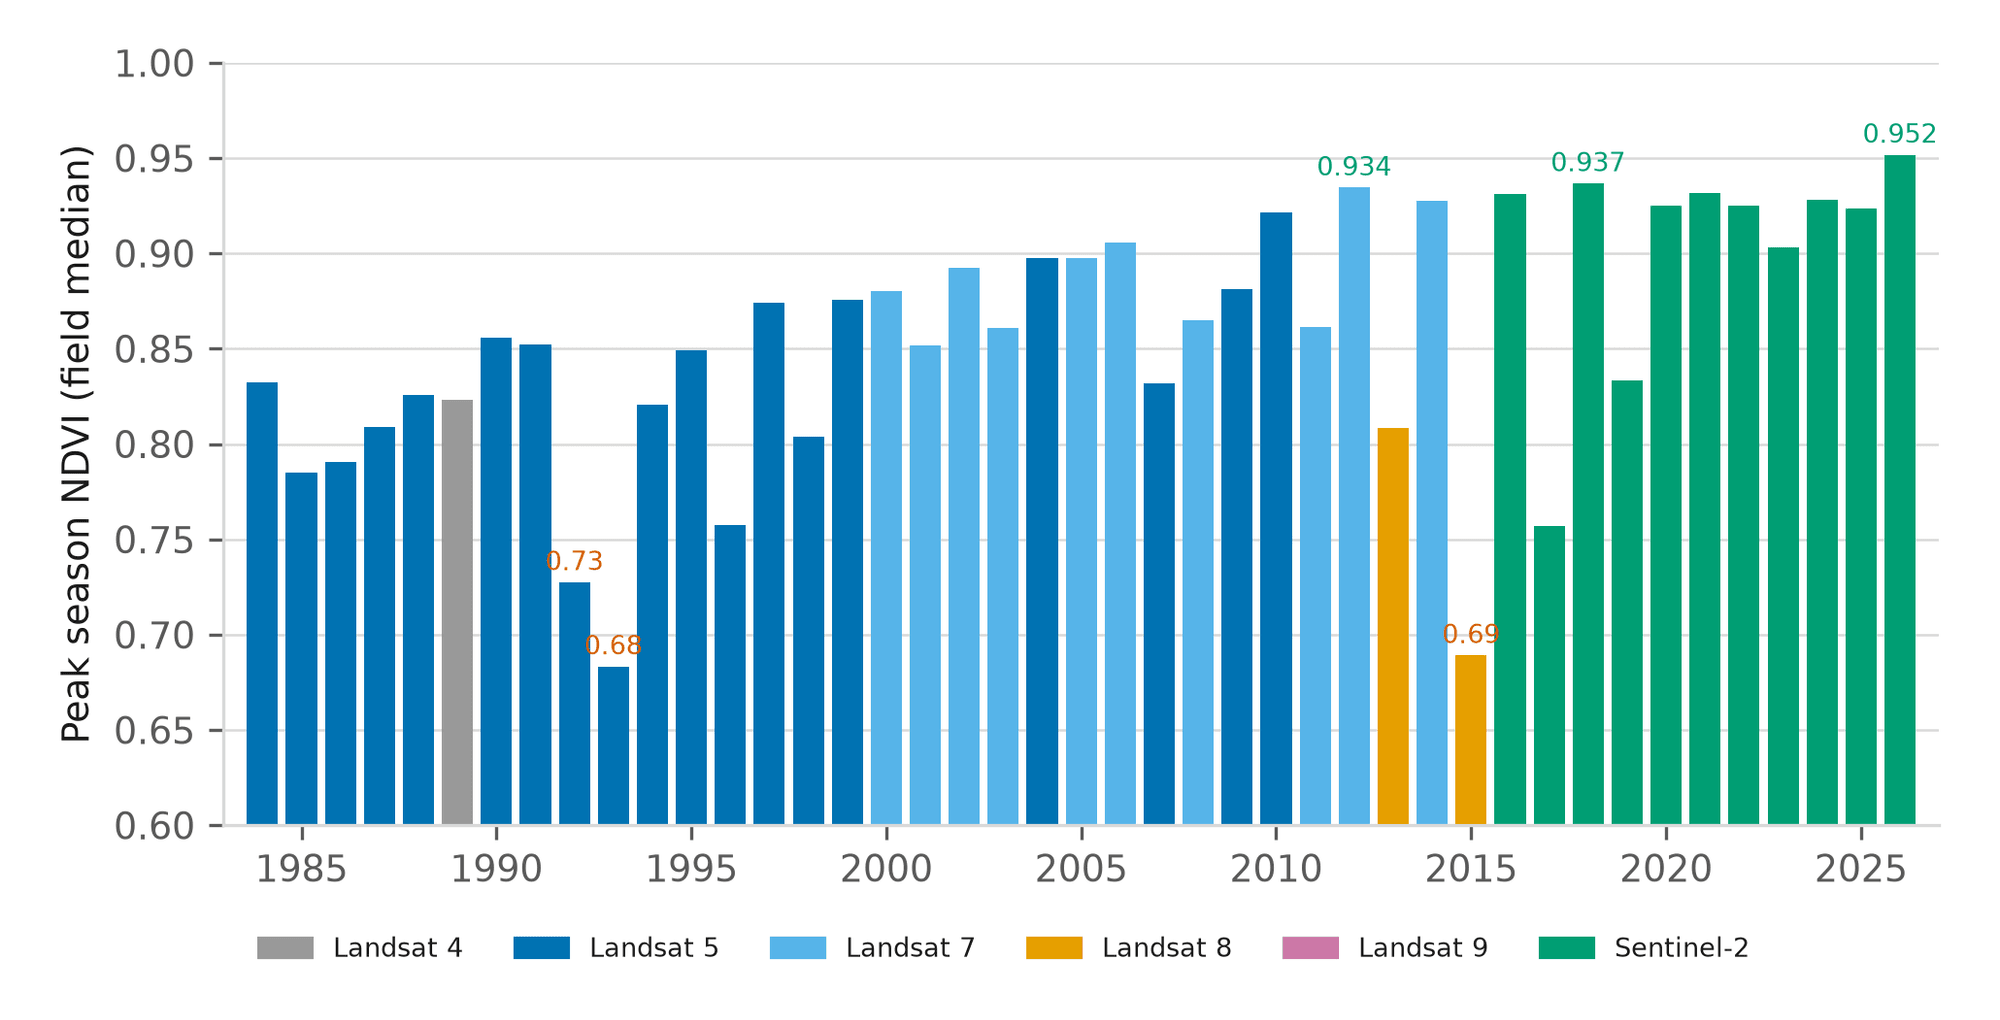
Before driving out, an agronomist wants to know whether this season is unusual for this field, not for the county. One centre pivot near Seward has a reading for every season from 1984 to 2026, and 2026 is the highest of them.
Three Italian assets, each read against its own history
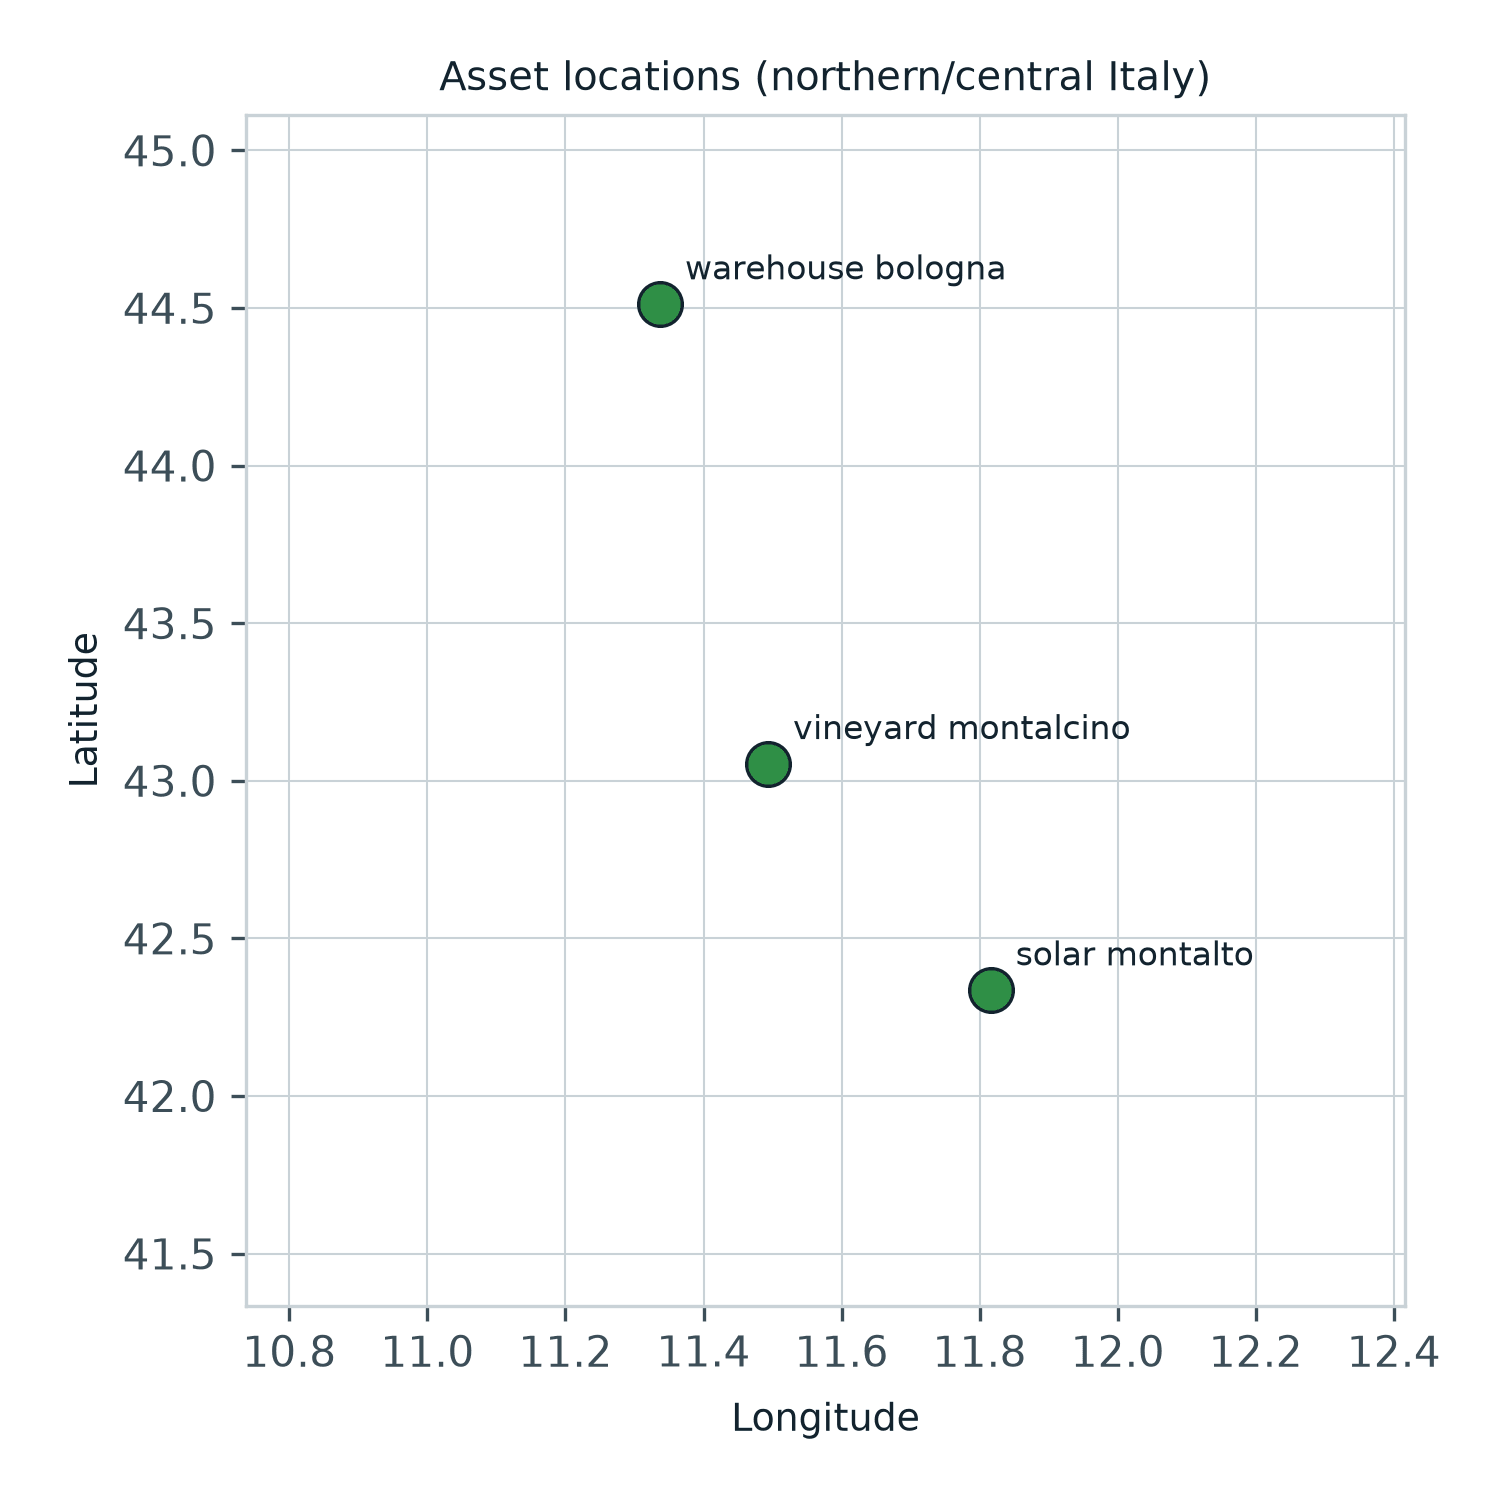
A warehouse changes almost never, a vineyard changes every season. Read against their own previous three years, a warehouse, a solar farm and a vineyard all sat within their usual range, and a second read returned the same figures.