
Storm Johannes: which stands to visit first, ranked from open imagery
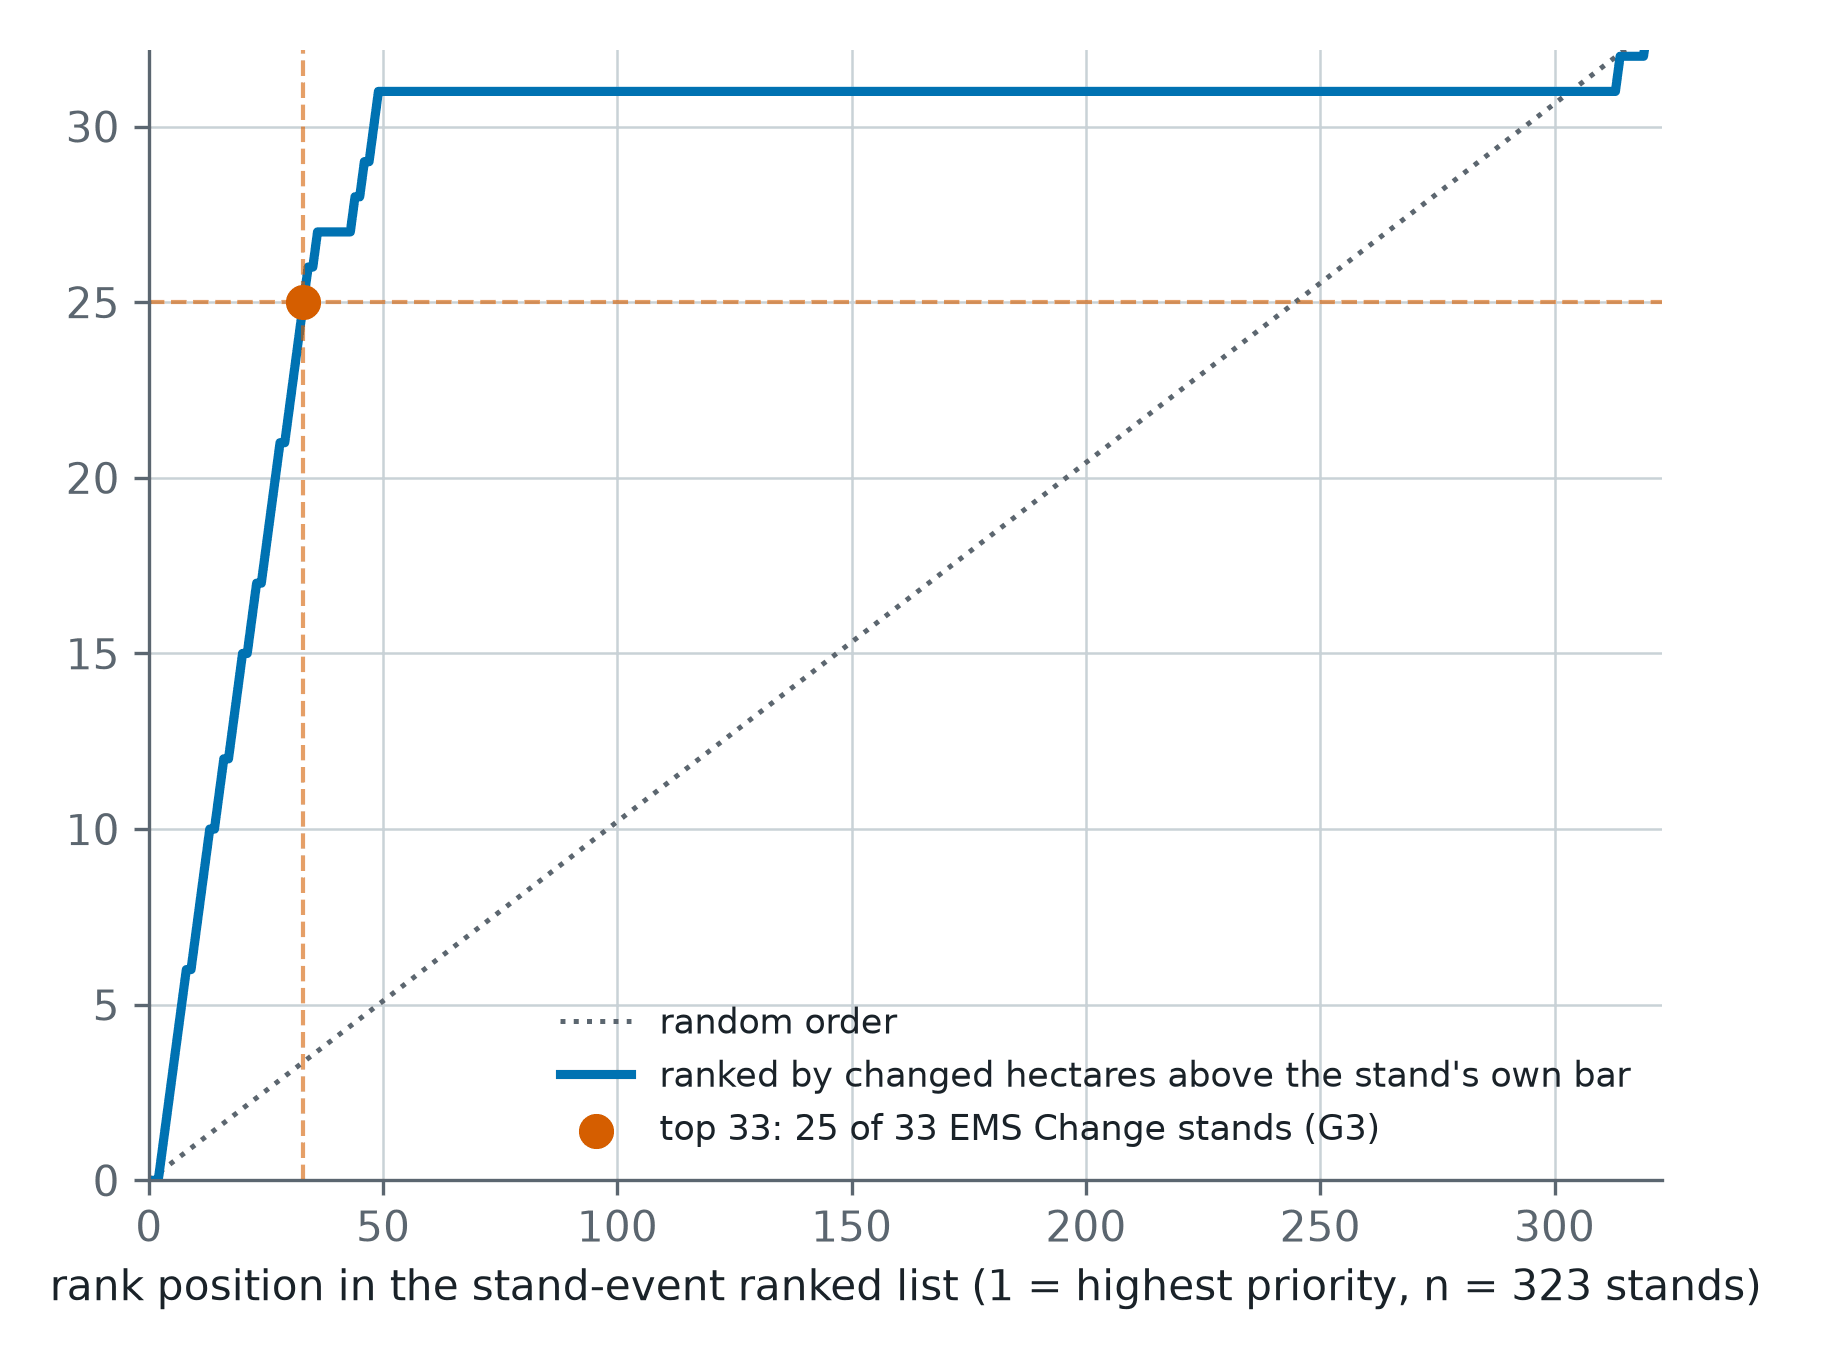
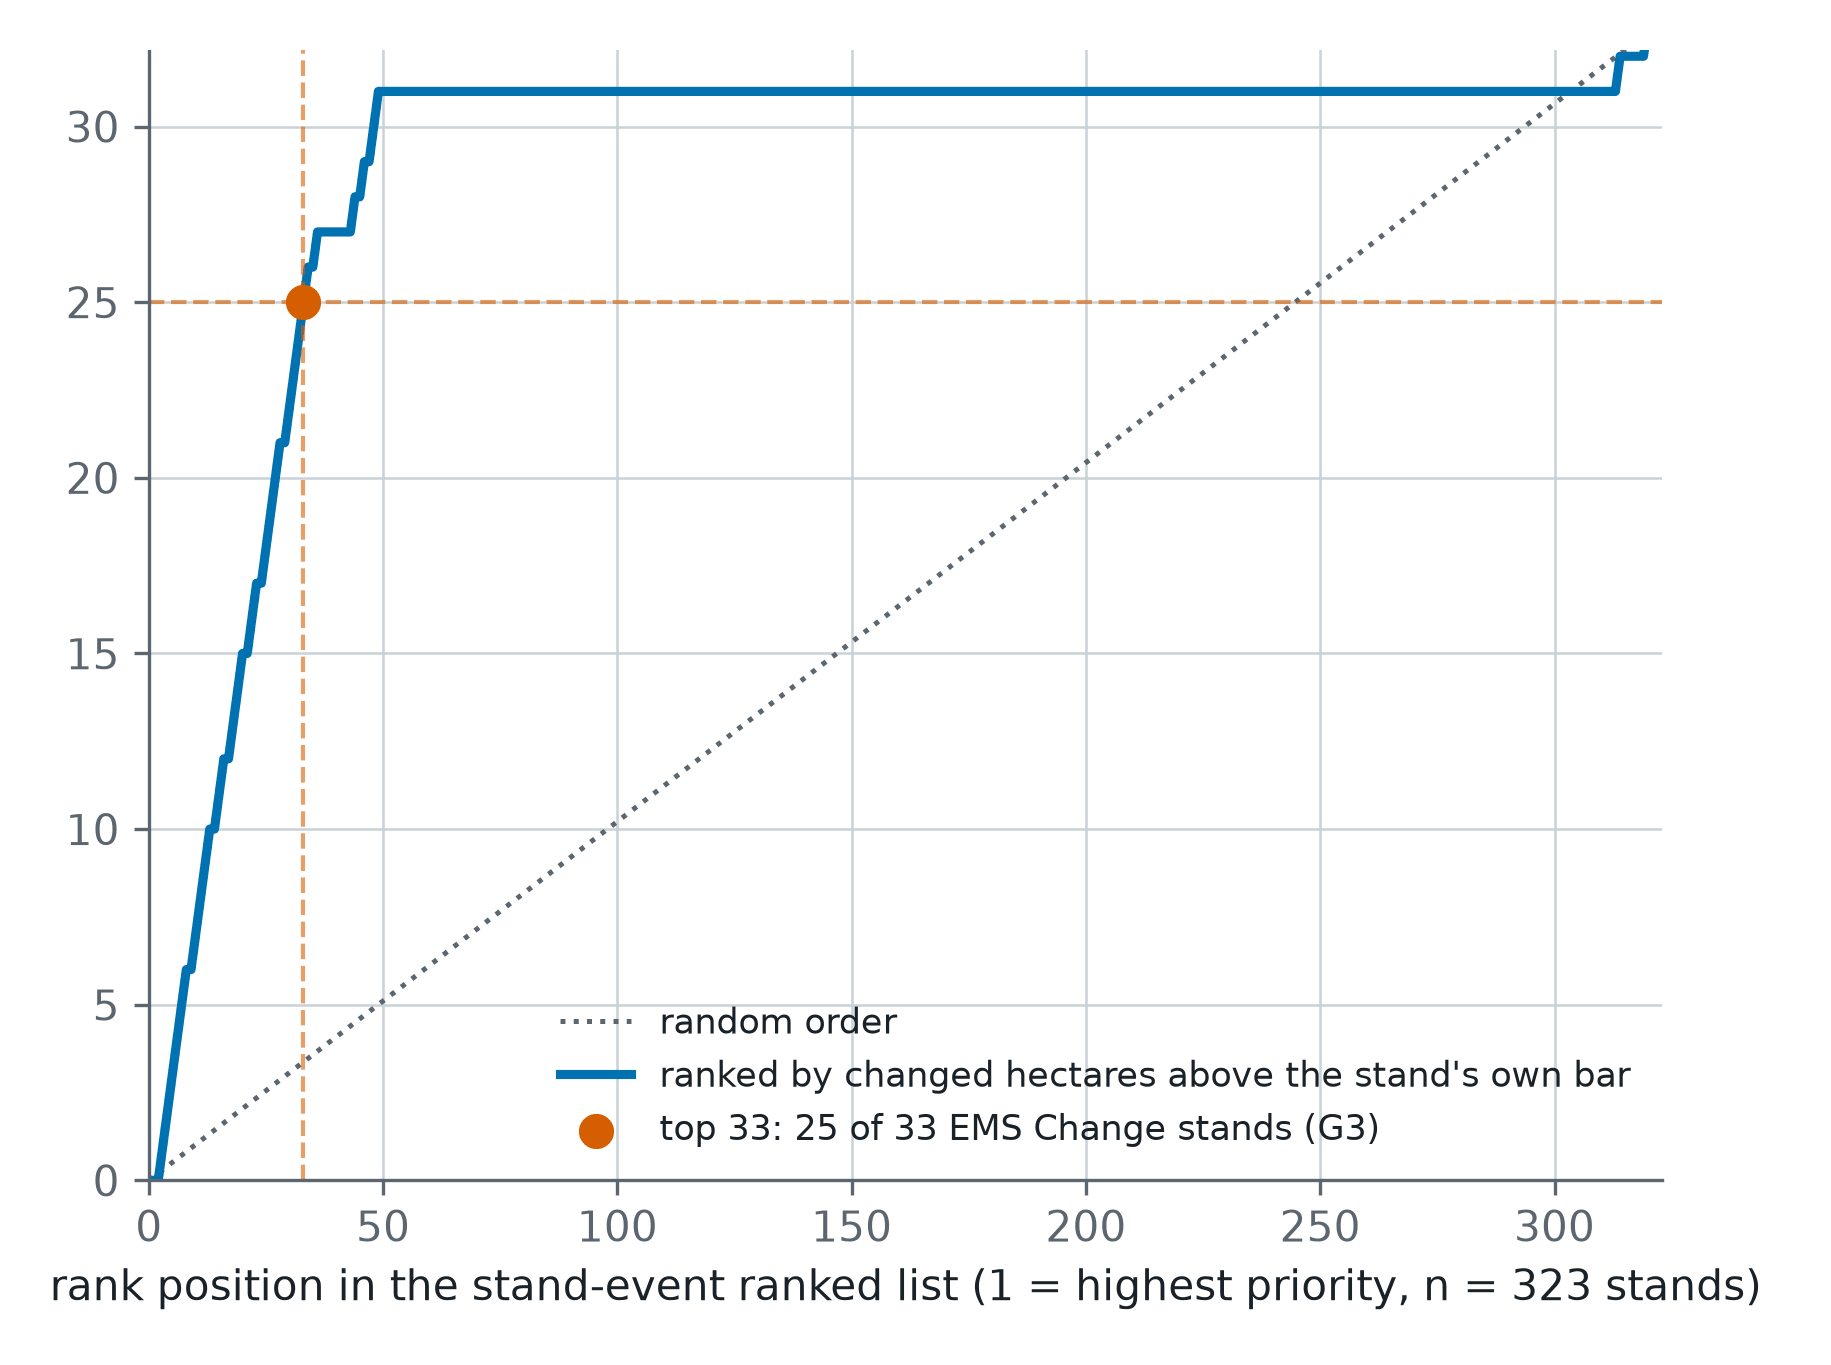
After the December 2025 storm in central Sweden, 323 test stands were ranked from Sentinel-1 and Sentinel-2. Of the 33 the storm had changed, 25 sat in the top 33 of the list. Random order would have put three or four there.
- Event
- Storm Johannes
- Dates
- 27 to 28 Dec 2025
- Region
- Central Sweden, conifer
- Test stands
- 323, 33 changed
- Top 33 of the list
- 25 changed stands
- Called above range
- 28 of 33 changed
- Reference
- Copernicus EMS grading
- Product
- Storm stand record
The problem
After a winter storm, an owner association or a forest insurer has hundreds of stands to check, snow on the ground, and a few weeks of field days to spend.
What we did
Every stand read from Sentinel-1 and Sentinel-2 against its own quiet years, then ranked by how much of it changed beyond that range.
The result
25 of the 33 changed stands in the first 33 places of a 323-stand list, against three or four for random order. The first field days go to the right stands.
Overview
Storm Johannes crossed central Sweden on 27 and 28 December 2025 and brought down conifer forest across the region. In the weeks after a storm like this the claims teams of forest insurers and the owner associations face the same problem: far more stands than people, short days, and snow on the ground.
The Copernicus Emergency Management Service mapped the event, and an independent reader graded 323 reference points from sub-metre imagery as changed or unchanged. That grading is the reference this case is scored against. It is one of our own test cases.
The challenge
After a storm, the first question is not how much timber came down. It is which stands to visit first. An association with members' estates across a county, or an insurer with a pile of new claims, needs a list in an order that puts the damaged stands at the top.
A forester's day is the scarce thing. Every visit to a stand that turns out to be standing is a visit not made to one that is down.
What we did
A one-hectare test stand was built on each of the 323 graded points: 33 changed by the storm and 290 unchanged. Every stand was read from Copernicus Sentinel-1 and Sentinel-2 against its own quiet years, so a stand that always changes a little in winter is not mistaken for storm damage.
The stands were then ranked by the area that changed beyond each stand's own range. The pass lines for the ranking were written down before any stand was read.
What the record showed
| Test stands | 323 |
| Changed by the storm, per the reference grading | 33 |
| Changed stands in the top 33 of the list | 25 |
| Expected in the top 33 from random order | three or four |
| Changed stands called above their own range | 28 of 33 |
| Unchanged stands called above their own range | 17 of 290 |
The ranked list put 25 of the 33 changed stands in its first 33 places. A random order would have put three or four there. By about place 50 the list has found 31 of the 33.
The record called 28 of the 33 changed stands above their own range, and 17 of the 290 unchanged ones. All three pass lines set before the read were met.
What it means
For an association or an insurer the ranked list says where the first field days should go, with every scene dated and a stand record for each stand. A visit list comes out as a CSV with stand centre points, ready for a drone flight plan, and the estate record goes to the members in their own language.
The test covers one winter storm in Swedish conifer forest. For an estate in the path of the next storm, the useful step is to load its stands before the season starts, so the record is ready the morning after.
Run this on your own ground
Draw an area of interest, pick the dates, and the same analysis runs against the archive over your sites.
References
- Axine Labs (2026). Forest records from open satellite archives: storm and beetle stand. Section 1.
- Copernicus Emergency Management Service. Activation EMSN231, Storm Johannes, Sweden.
- European Space Agency. Copernicus Sentinel-1 and Sentinel-2 missions. sentinels.copernicus.eu
More case studies
Forty-three seasons of one Nebraska pivot, and its first zone map
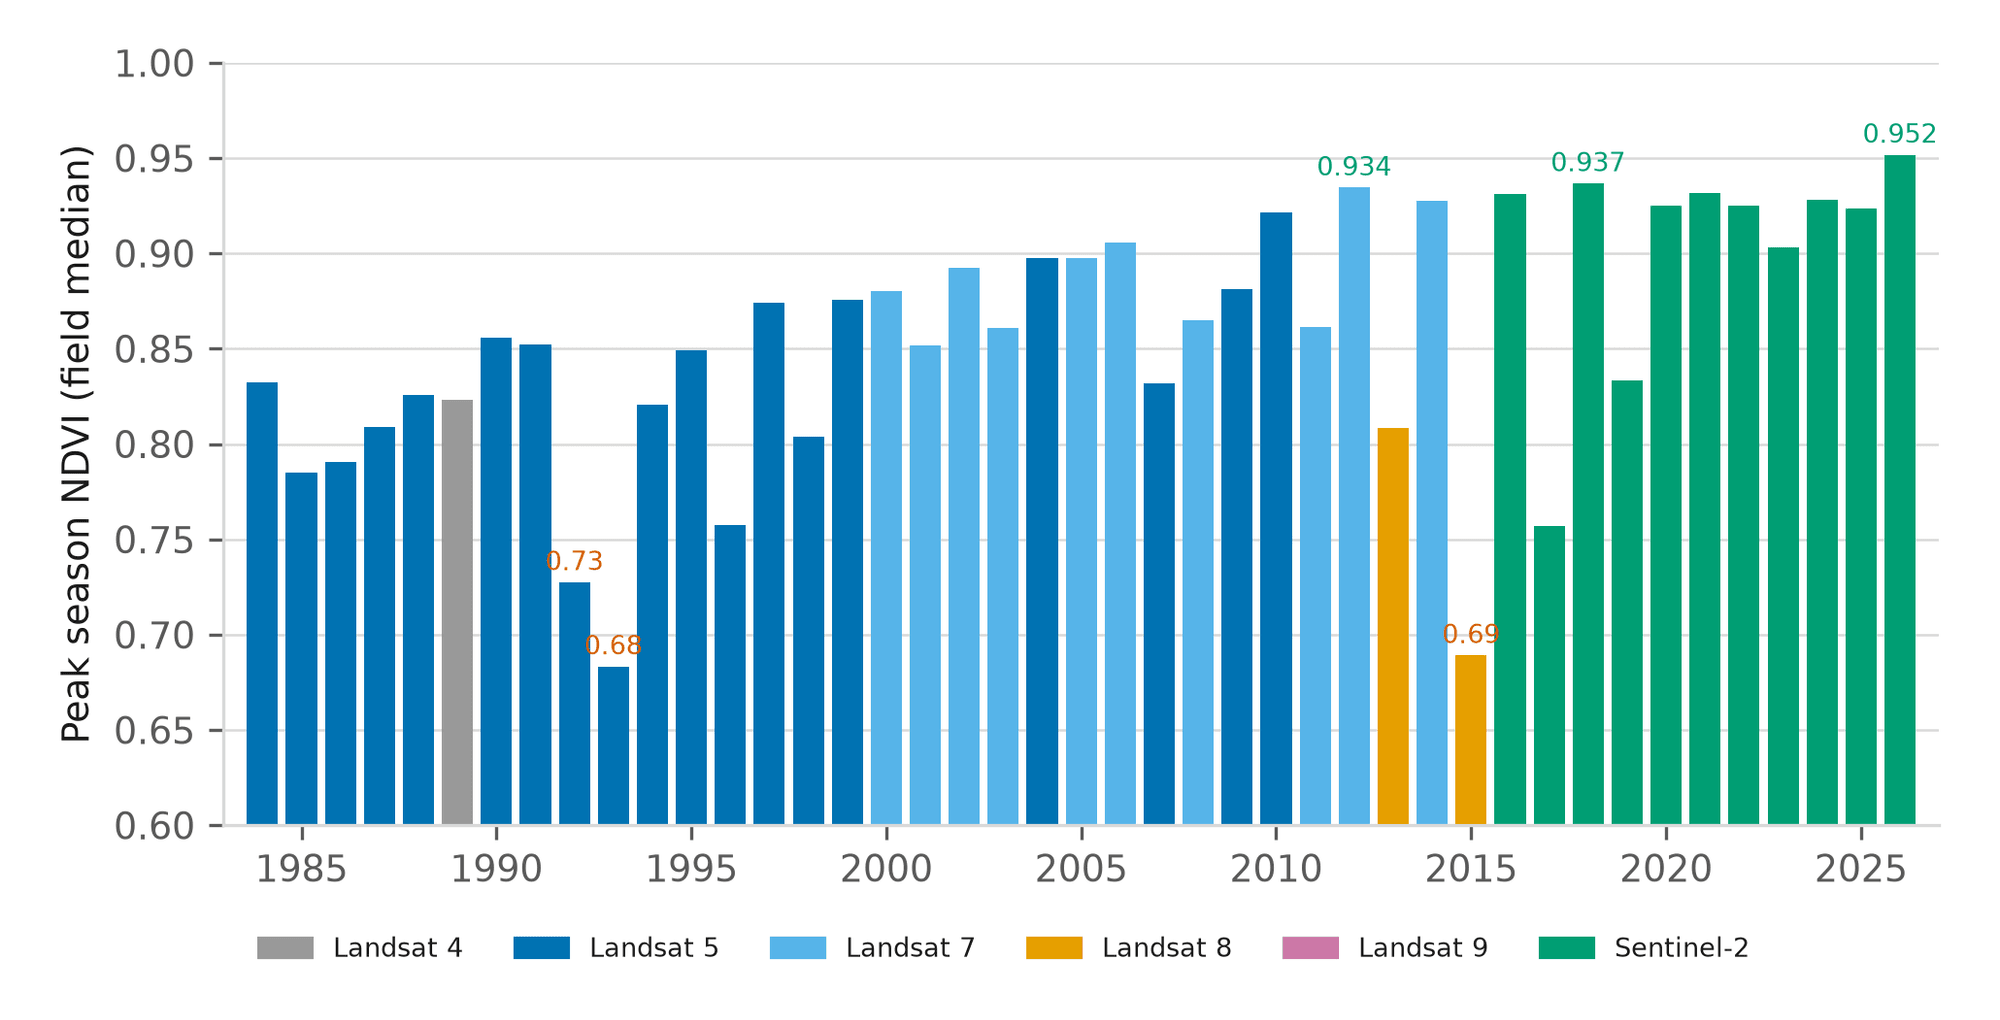
Before driving out, an agronomist wants to know whether this season is unusual for this field, not for the county. One centre pivot near Seward has a reading for every season from 1984 to 2026, and 2026 is the highest of them.
A Kansas season on one page, and the next two weeks of disease pressure
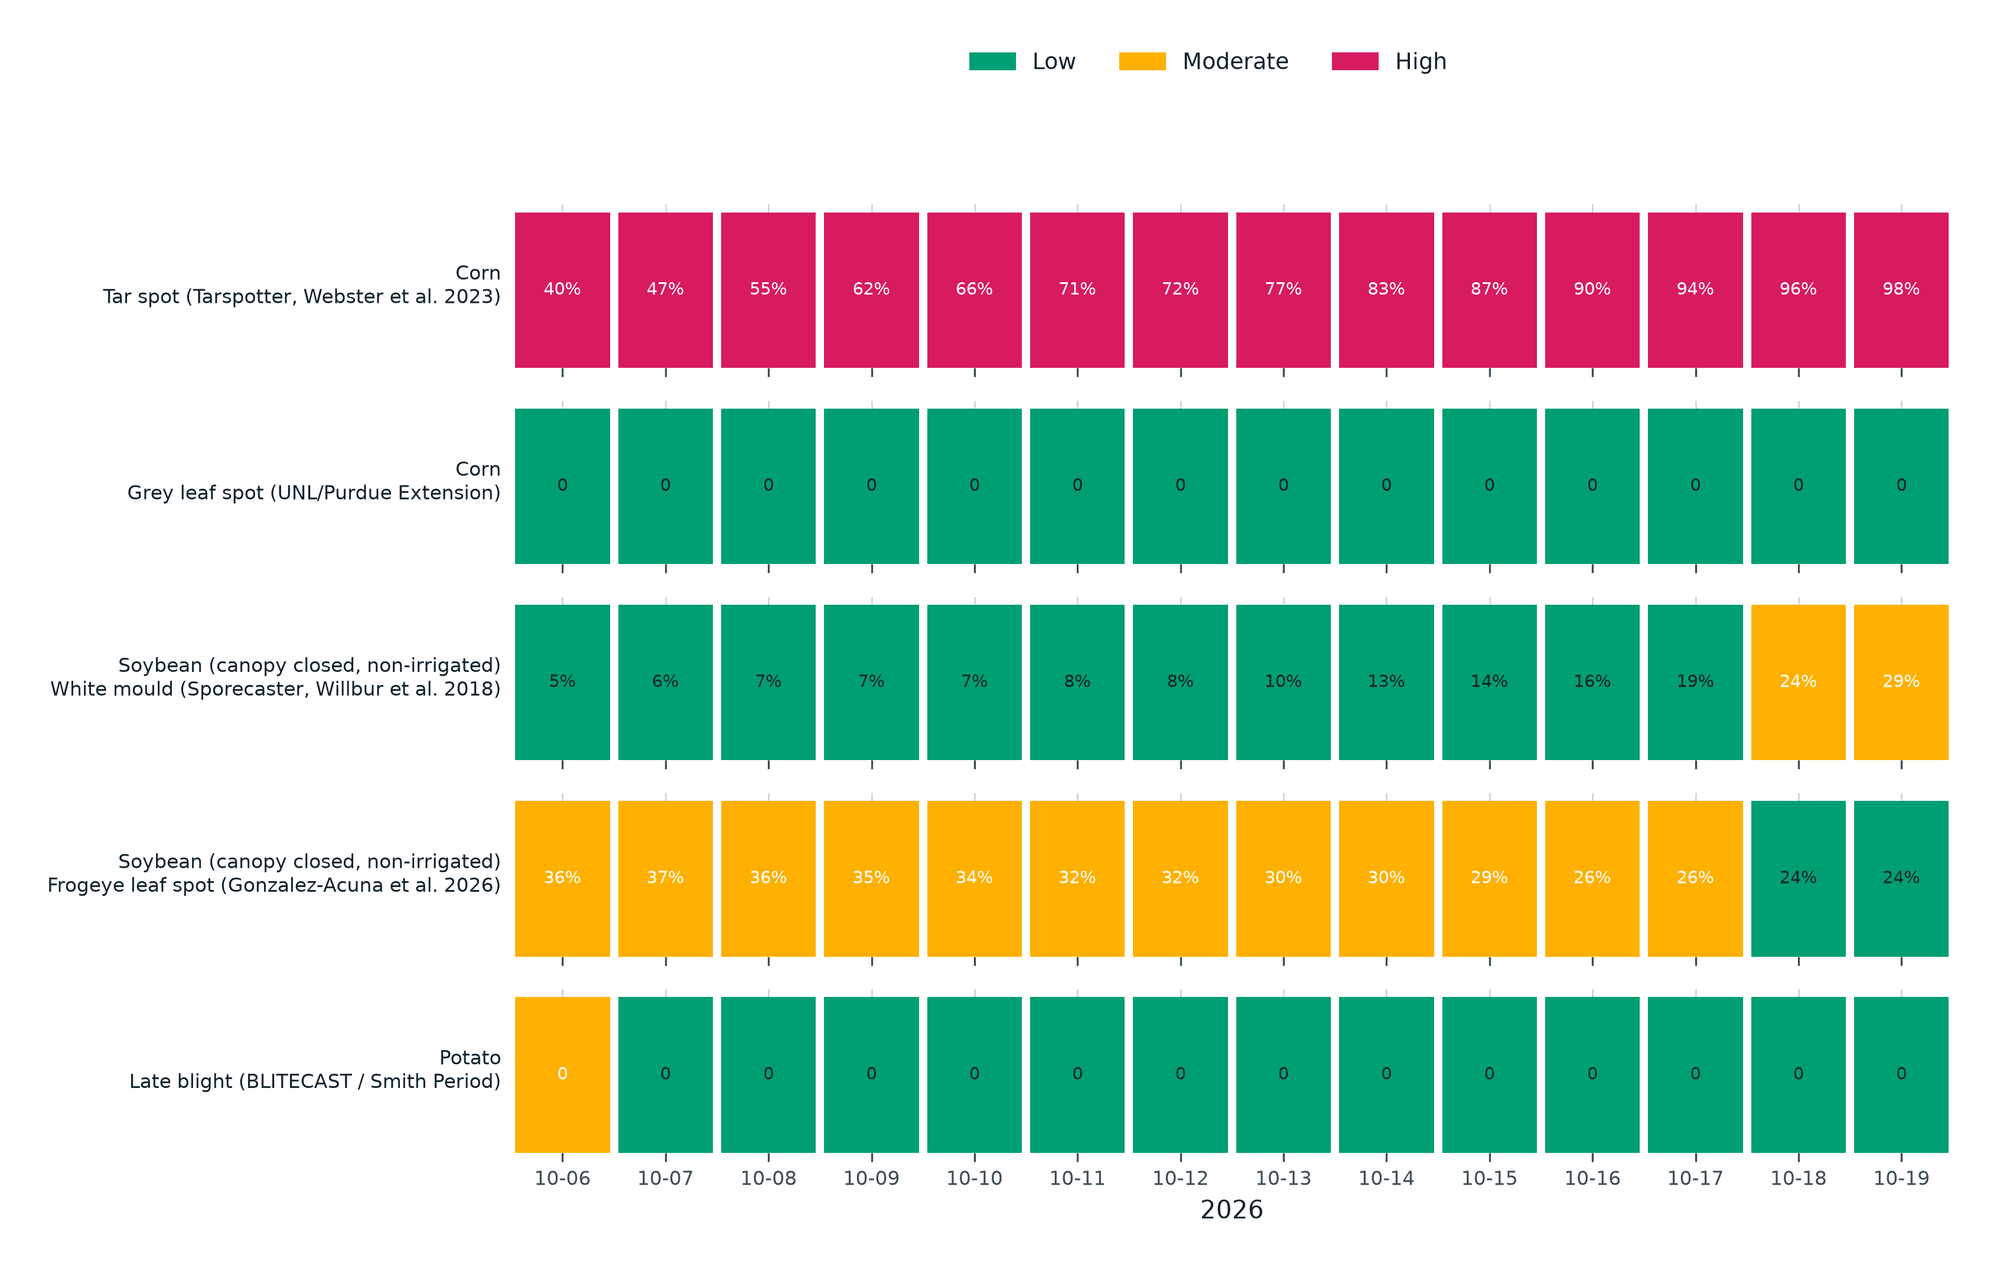
A 61-hectare corn pivot in western Kansas, 184 days into the 2026 season: 53 days at or above 35 °C against a normal of 27.8, more heat units than usual, and five published disease models run on the field's own forecast.
Three Italian assets, each read against its own history
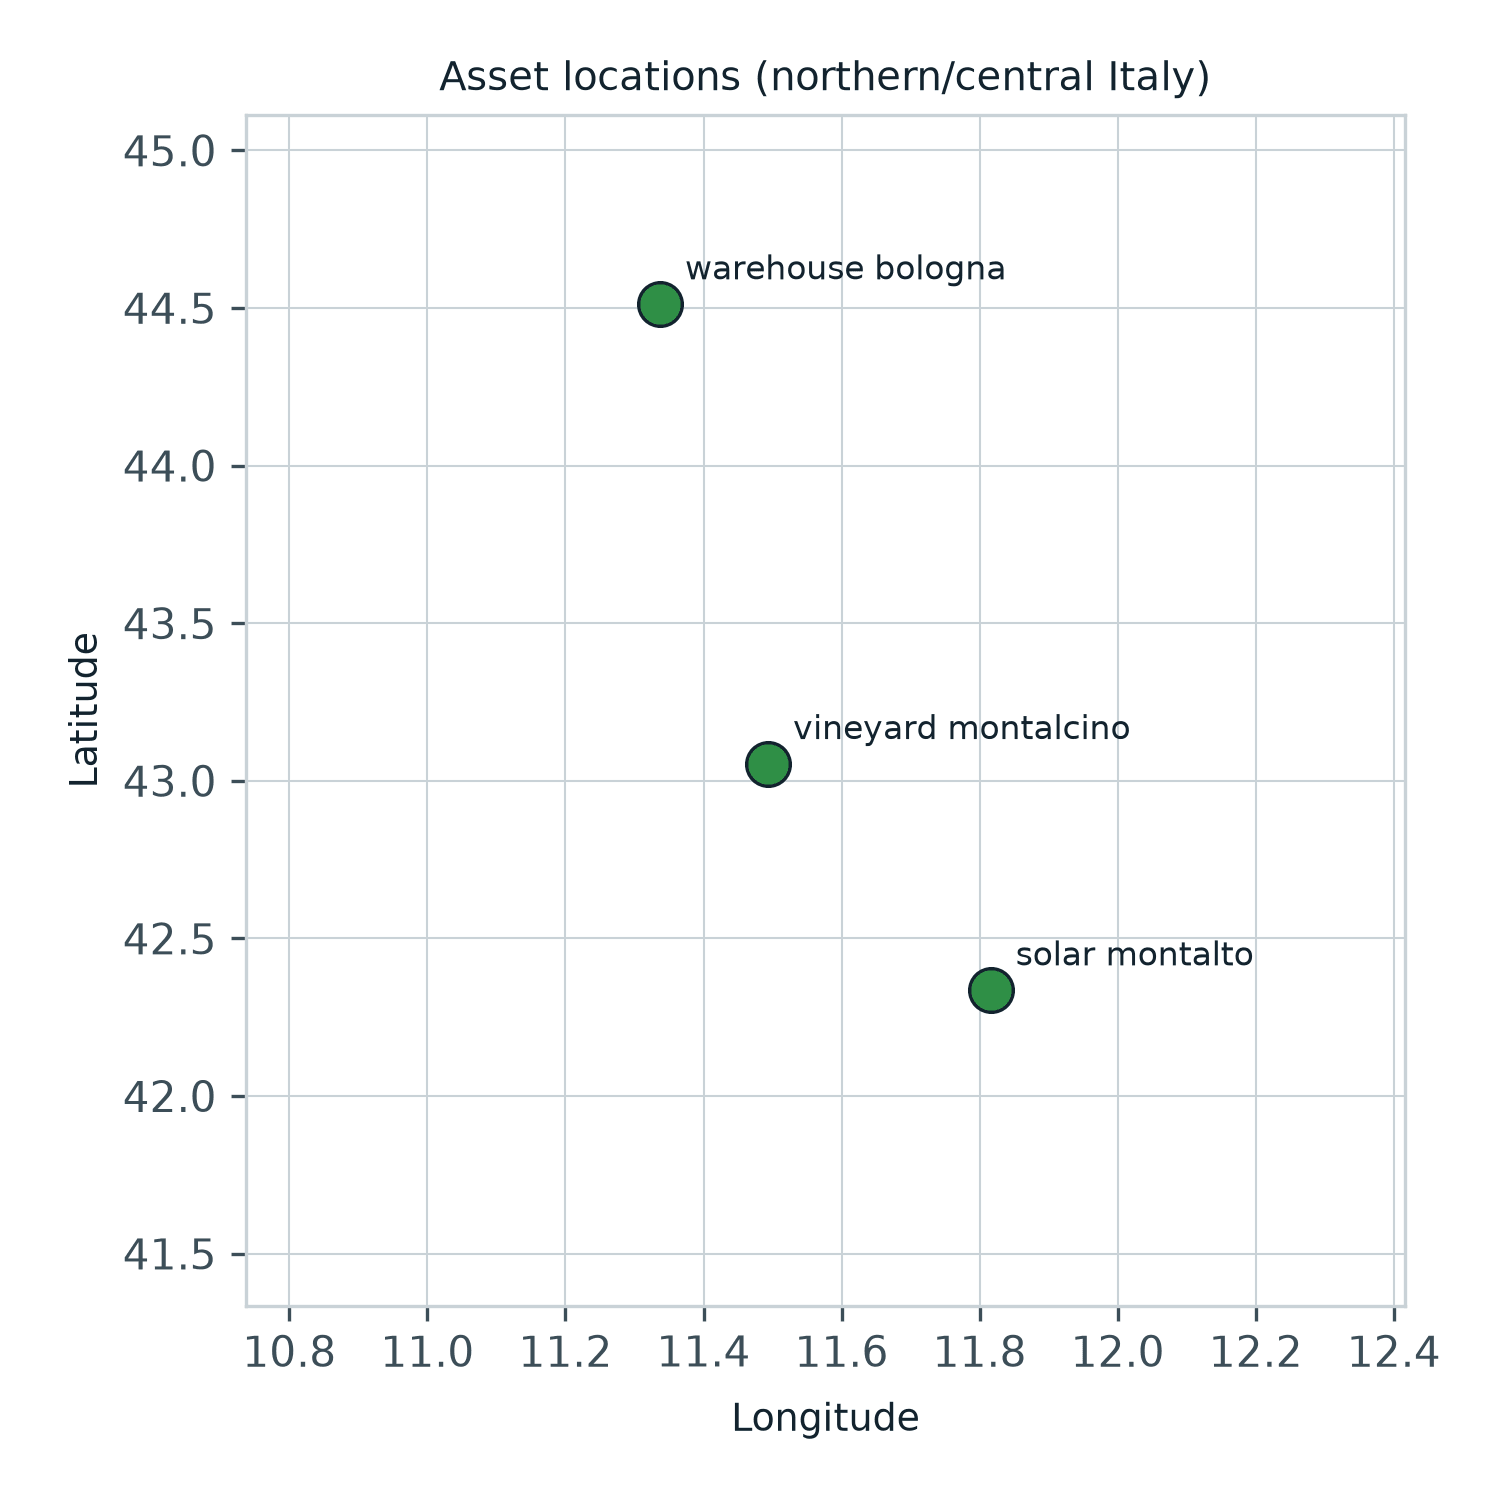
A warehouse changes almost never, a vineyard changes every season. Read against their own previous three years, a warehouse, a solar farm and a vineyard all sat within their usual range, and a second read returned the same figures.