
Case study: mapping alteration over a historic Nevada district
A full hyperspectral scene over the reference district for imaging spectroscopy, classified per pixel and checked against an independent expert system.
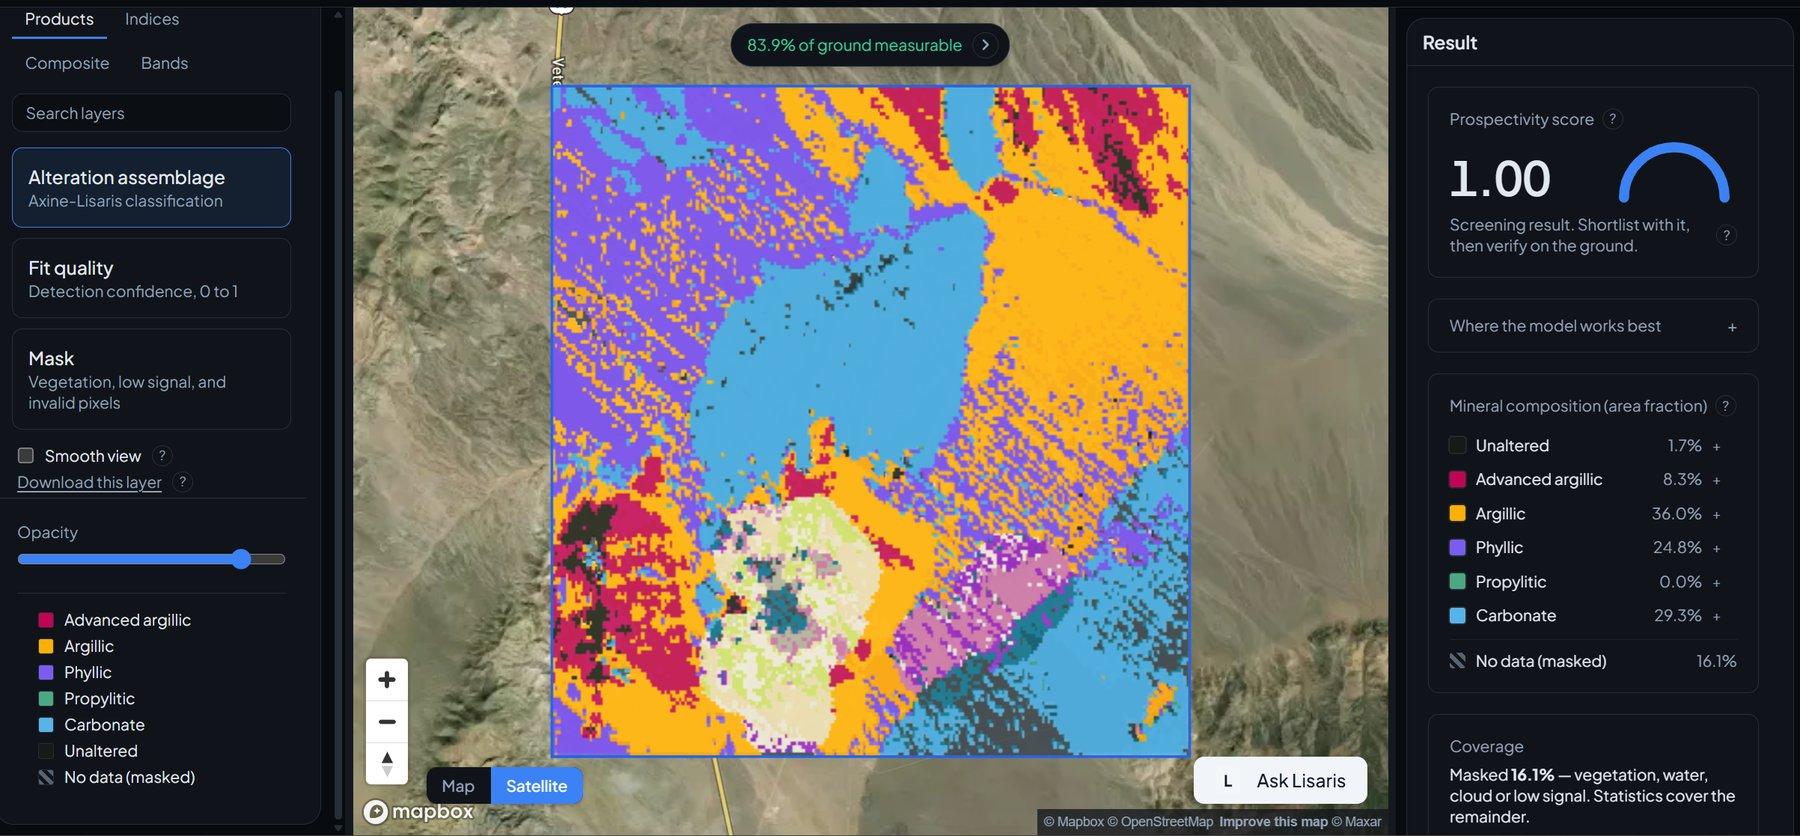
This district in Nevada is the reference site of imaging spectroscopy. Decades of airborne campaigns, field spectrometry and published maps make it the one place on Earth where a mineral map from orbit can be checked against ground truth line by line. That is why we run ours here.
The method
A full scene came in at the archive's own surface reflectance level. Where the instrument measured nothing, the gap was declared and carried through rather than interpolated across.
Every pixel's curve was then continuum-removed and fitted against a library of laboratory reference spectra, so a material is identified by the shape and position of its absorption rather than by a colour rule. The same scene was also processed end to end by USGS Tetracorder 5.27 in a sealed container, giving an independent expert-system result to read alongside ours.
Ground that could not be evaluated stayed out. Vegetation, low signal and atmospheric interference put a pixel into a separate not-evaluated class, hatched in the legend and null in the exports.
The results
The materials panel lists what the run found: alunite, kaolinite group clays, hematite and the rest, each with the fraction of the scene it explains and the strength of its fit. The map paints the dominant material per pixel, and clicking any pixel shows the observed curve against the reference it matched.
Read side by side, the two engines agree on the zonation that matters to an exploration team: the advanced argillic core, the argillic ground around it, and the phyllic halo further out. Where they disagree, both answers are on screen with their fit quality attached, which is the point of running them together.
The mineral lane runs under Professional and Enterprise plans. This site is part of the demo workspace, so you can open it and inspect the pixels yourself.
Run this on your own ground
Draw an area of interest, pick the dates, and the same analysis runs against the archive over your sites.
More case studies
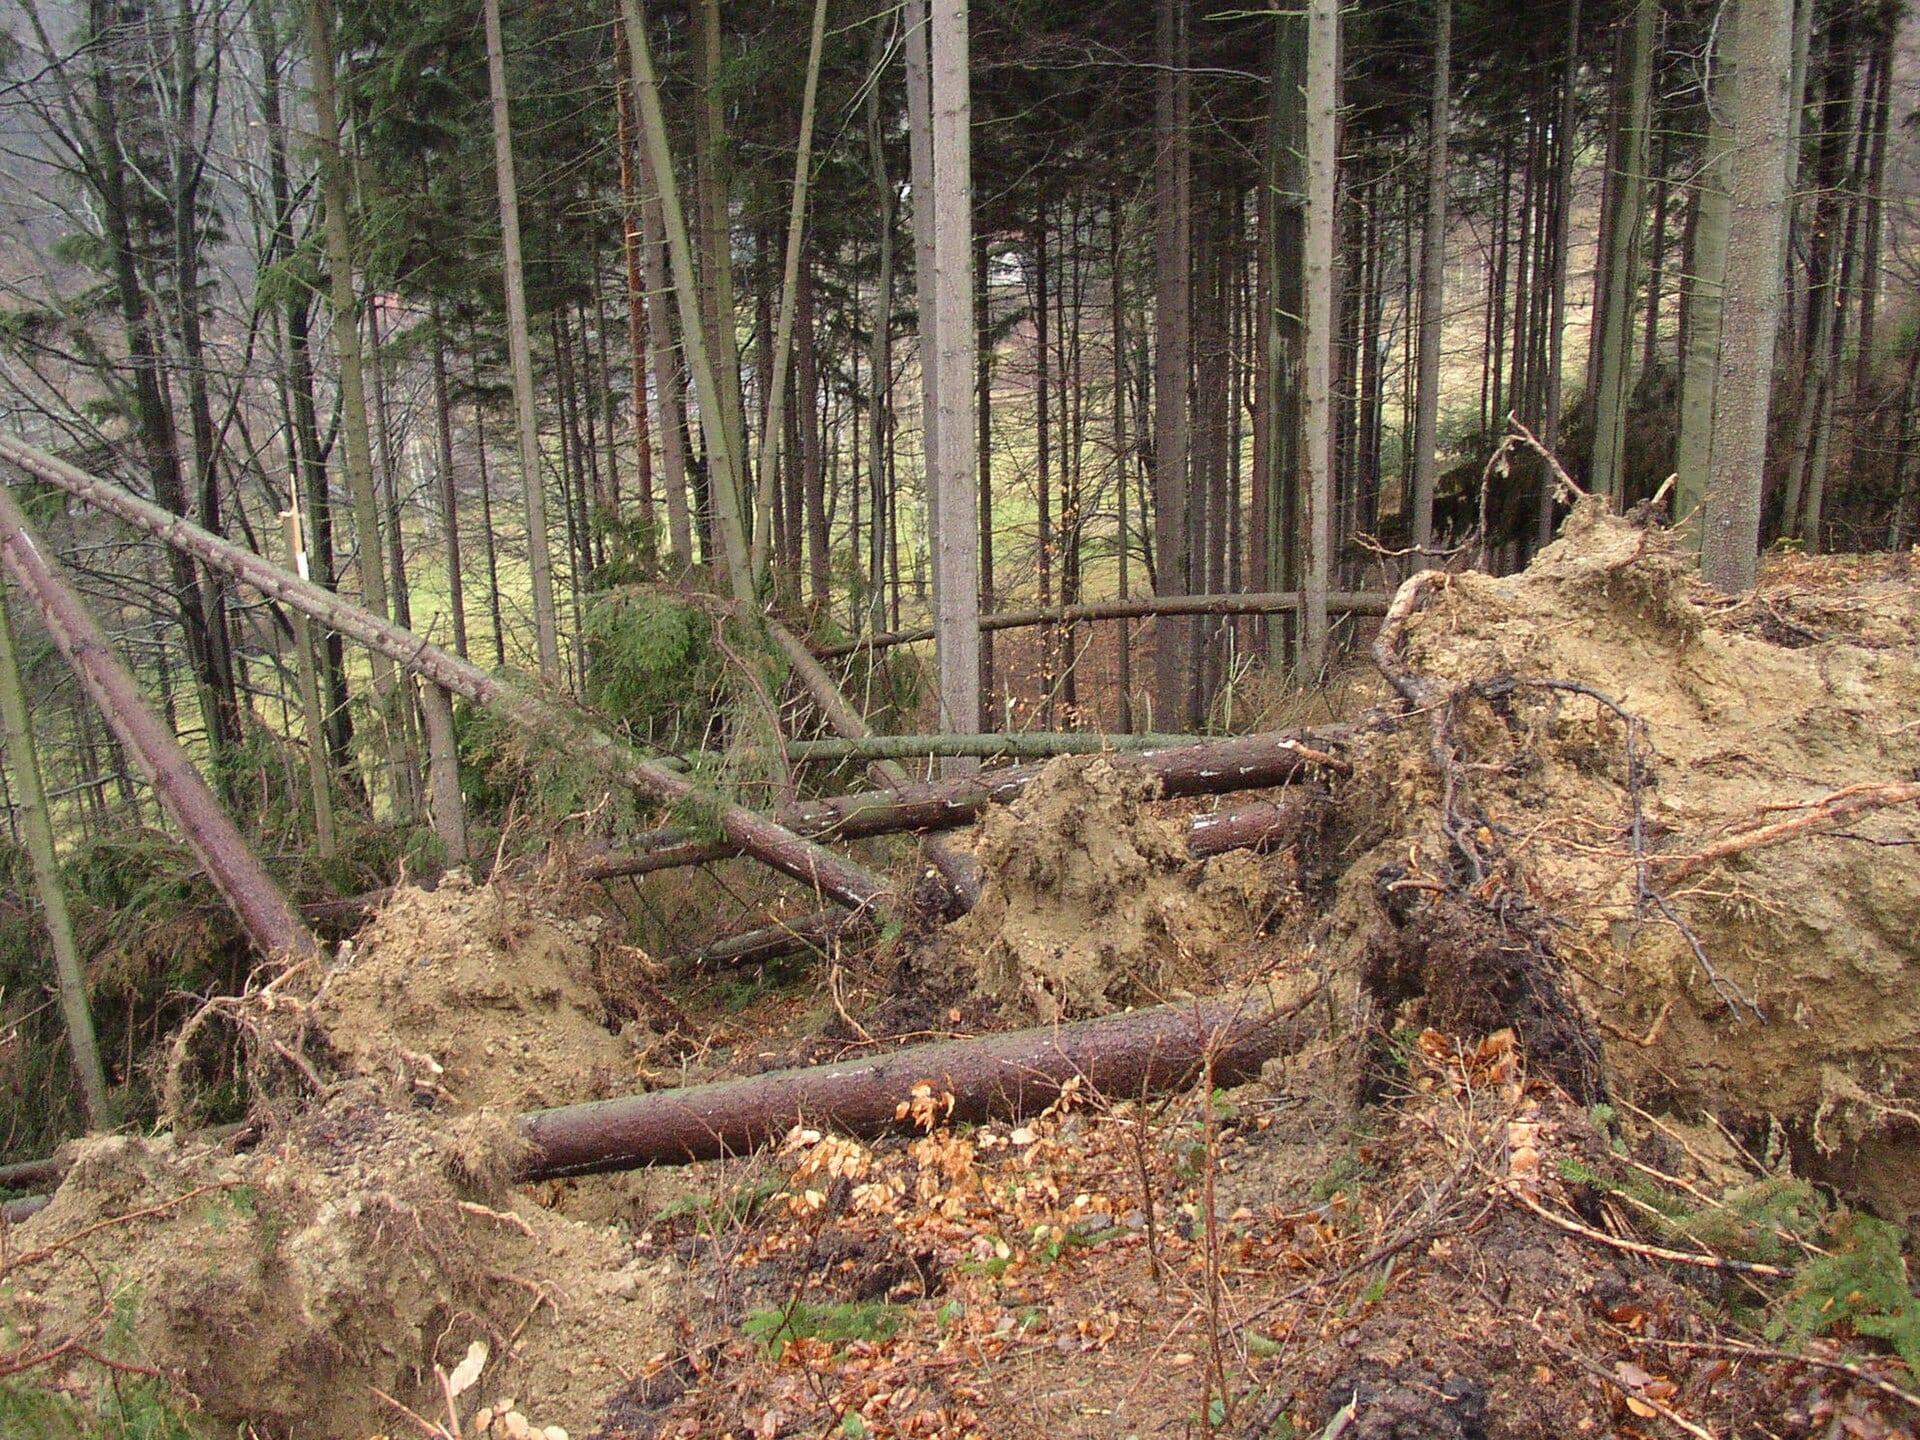
Mapping Vaia windthrow when salvage was a race against the timber's own value
The Vaia storm flattened 42,525 hectares of Alpine forest and collapsed the roundwood market. Salvage depended on reaching the right stands first, and the emergency mapping activation covered under a tenth of the damage.
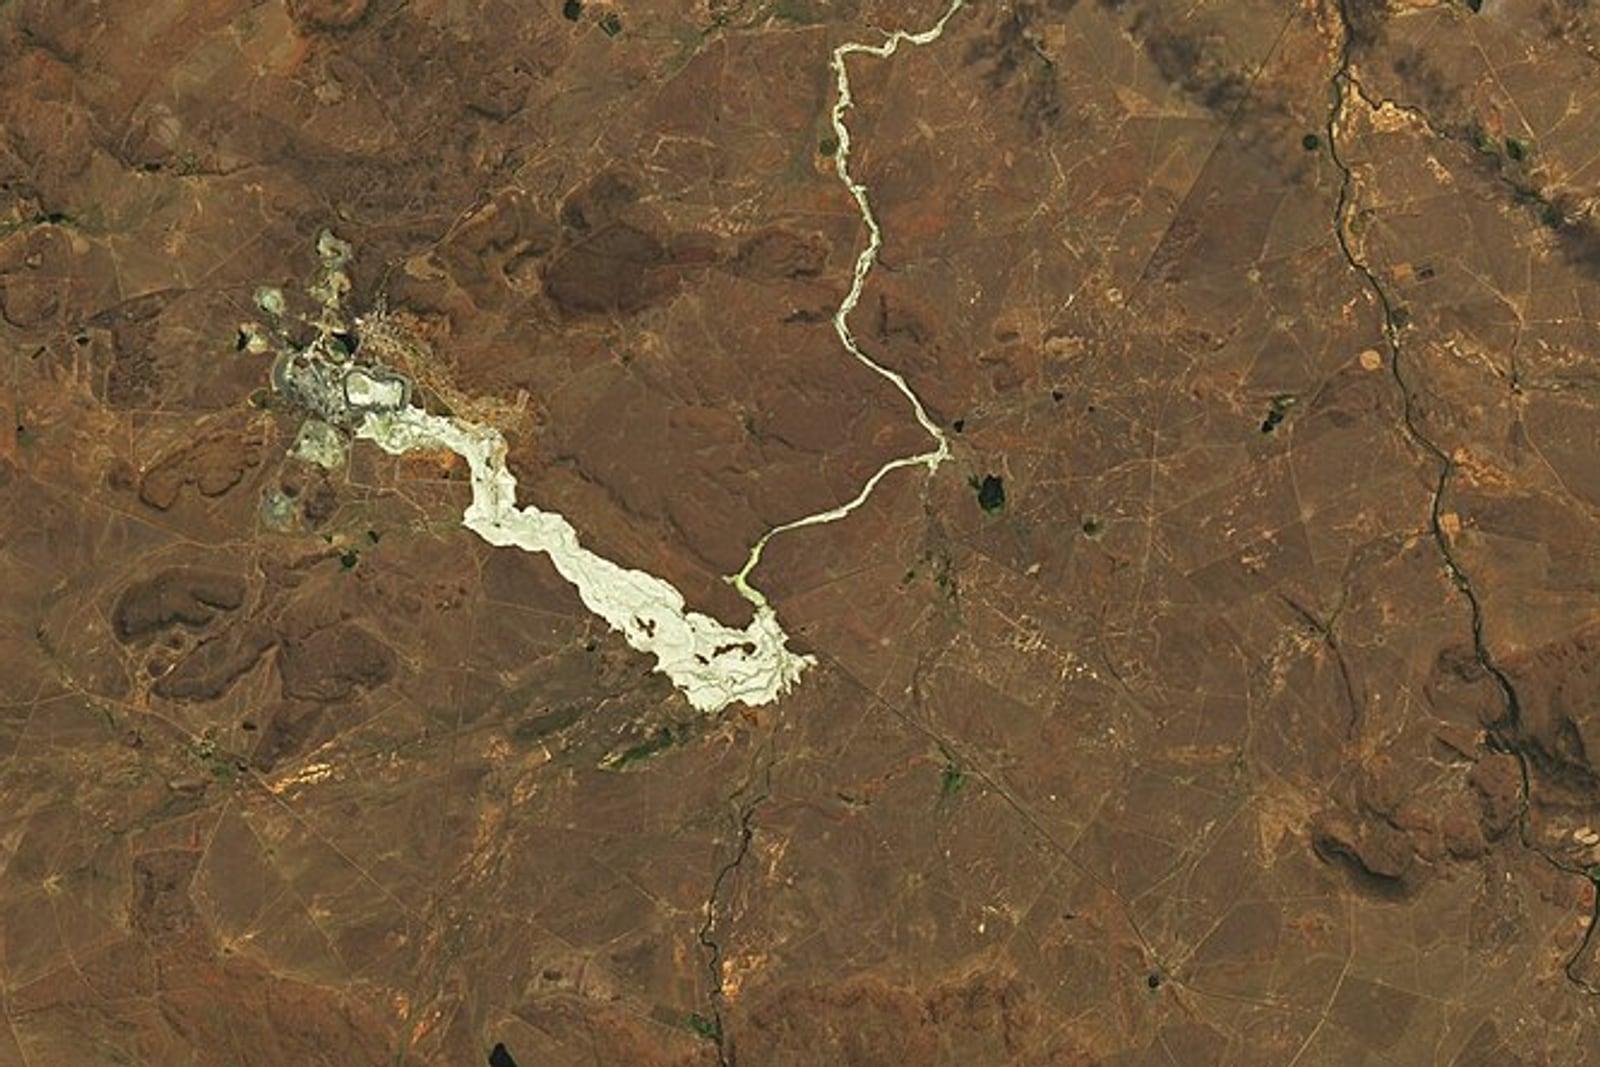
Mapping the Jagersfontein tailings flow five days after the dam broke
A diamond mine tailings dam failed in the Free State and buried working farmland. Three years on, no footprint of it had been published, and the two area figures in the literature disagree by a factor of 1.6. We mapped it from five archive passes.
Measuring the 2022 Po drought against Italy's own rice loss survey
In July 2022 the Po fell to an eighth of its normal flow. We measured the collapse across the Lomellina rice district at the threshold Italy's rice authority uses, and put the result beside the hectares they published.