
Jasper Wildfire Burn Extent Mapped Within 6.5 Per Cent of Canada’s National Reference
Burn extent for the 2024 Jasper Wildfire Complex from four archive scenes: a 29,597 hectare connected scar against a 31,645 hectare national reference.

- Location
- Jasper National Park, Alberta
- Area
- 29,597 hectare connected burn scar
- Record
- Ignition 22 July 2024, four scenes from 24 June to 4 September 2024
- Deliverables
- Burn extent map, connected scar area, pre-fire control, published reference comparison
The problem
Insurers and the park authority required a burn extent for the 2024 Jasper fire, and the definitive burn map was published fifteen months after ignition.
What we did
Four archive scenes on a single acquisition path, scored at the published Key and Benson burn ratio break over ground vegetated before the fire, with a pre-fire pair as the control.
The result
A 29,597 hectare connected scar, 6.5 per cent below Canada’s national figure, available in the archive thirteen months before the definitive map.
The Objective
Insurers setting reserves and park authorities scoping salvage and closure require a burn extent within weeks of a fire. The Jasper Wildfire Complex ignited on 22 July 2024 and entered the town on 24 July, destroying 358 of 1,113 buildings, with insured losses of just under $1.3 billion. No international rapid mapping service was activated, the smoke plume obscured the fire’s head from satellite fire detection on 24 July, and the authoritative burn map was published in October 2025, fifteen months after the fire. The operational requirement is a burn extent from archive imagery, measured against the published national reference.
Scene Selection and Burn Ratio Test
The platform analysed the park and the town on a box drawn from the national burn perimeter with about ten kilometres of margin. Every input below was fixed before scoring:
- Pre-fire scenes: 24 June and 10 July 2024.
- Post-fire scenes: 19 August and 4 September 2024.
- Acquisition path: the one path of three over the area that covers the whole burn, with full coverage of the box on every scene.
- Masking: cloud, shadow and snow removed using the mission’s own quality band.
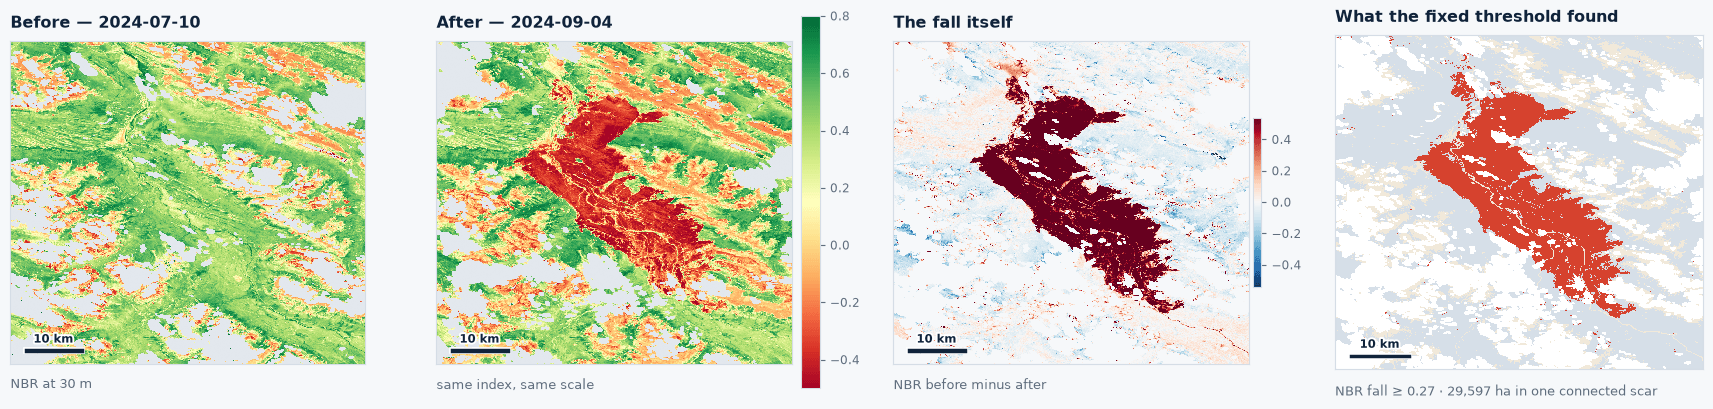
Ground counts as burned where the normalised burn ratio falls past the Key and Benson reference break, a published value the platform applies unchanged and does not fit to this fire. Scoring runs only over ground that carried vegetation before the fire. To establish the noise floor, the system runs the same test across the two pre-fire scenes, four weeks in which nothing burned.
Burn Extent Findings
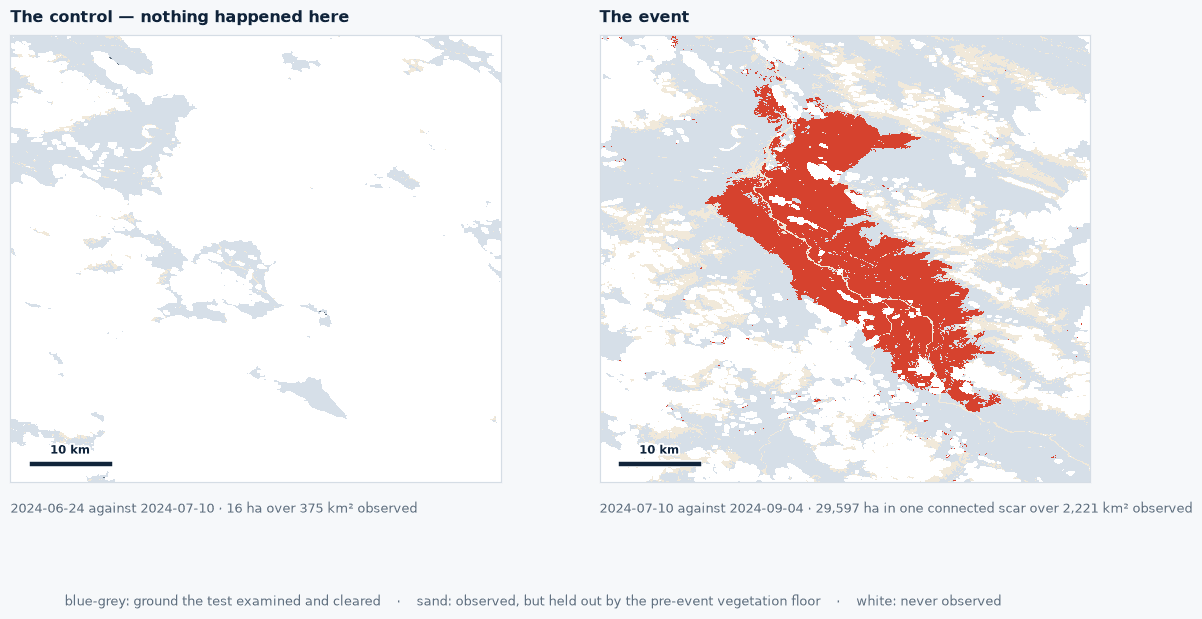
The pipeline returned a single connected scar on both post-fire dates, with the control establishing the floor.
- Control, 24 June against 10 July 2024: 16 hectares.
- 19 August, 28 days after ignition: a connected scar of 26,998 hectares within 45,532 hectares of total change.
- 4 September, 44 days after ignition: a connected scar of 29,597 hectares within 45,599 hectares of total change.
The connected component is the quantity that corresponds to what the national reference measures. Total change across the box also captures the fire’s low severity edge, which a fixed threshold reads differently from a hand drawn perimeter.
Comparison With Published References
The 4 September scene is the comparison scene, four days before the national reference capture on 8 September 2024.
- This study, 4 September scene: 29,597 hectares, fixed threshold with a control.
- National Burned Area Composite, Natural Resources Canada, 8 September 2024: 31,644.6 hectares.
- Canadian Forest Service report NOR-X-433, October 2025: 32,281 hectares.
- Parks Canada operational final size at under control, 7 September 2024: 32,722 hectares.
The three published figures span about a thousand hectares, roughly 3 per cent. The platform’s figure lands 6.5 per cent below the national composite, from a published threshold applied with no calibration to this fire and no reference to the official perimeter at any point in the calculation.
Operational Utility
The 4 September scene was in the archive thirteen months before the definitive map was published. Insurers set reserves, and park authorities scope salvage and closures, on a measured burn extent rather than an incident command estimate. Each figure carries its scene dates, its mask and its control, so the number can be read against any later reference. The record maps burn extent across vegetated ground; structure losses are counted on the ground.
Run this on your own ground
Draw an area of interest, pick the dates, and the same analysis runs against the archive over your sites.
References
- Natural Resources Canada, Canadian Wildland Fire Information System, National Burned Area Composite. cwfis.cfs.nrcan.gc.ca
- Canadian Forest Service (2025). Jasper Wildfire Complex 2024: fire behaviour documentation, reconstruction, and analysis. Information Report NOR-X-433.
- Parks Canada, Jasper wildfire timeline.
- Municipality of Jasper (2025). 2024 Jasper Wildfire Complex Municipal After-Action Review.
- Insurance Bureau of Canada, insured losses from the Jasper wildfire rise to just under $1.3 billion, 25 July 2025.
- Key C.H. and Benson N.C. (2006). Landscape assessment: sampling and analysis methods. FIREMON, USDA Forest Service RMRS-GTR-164-CD.
More case studies
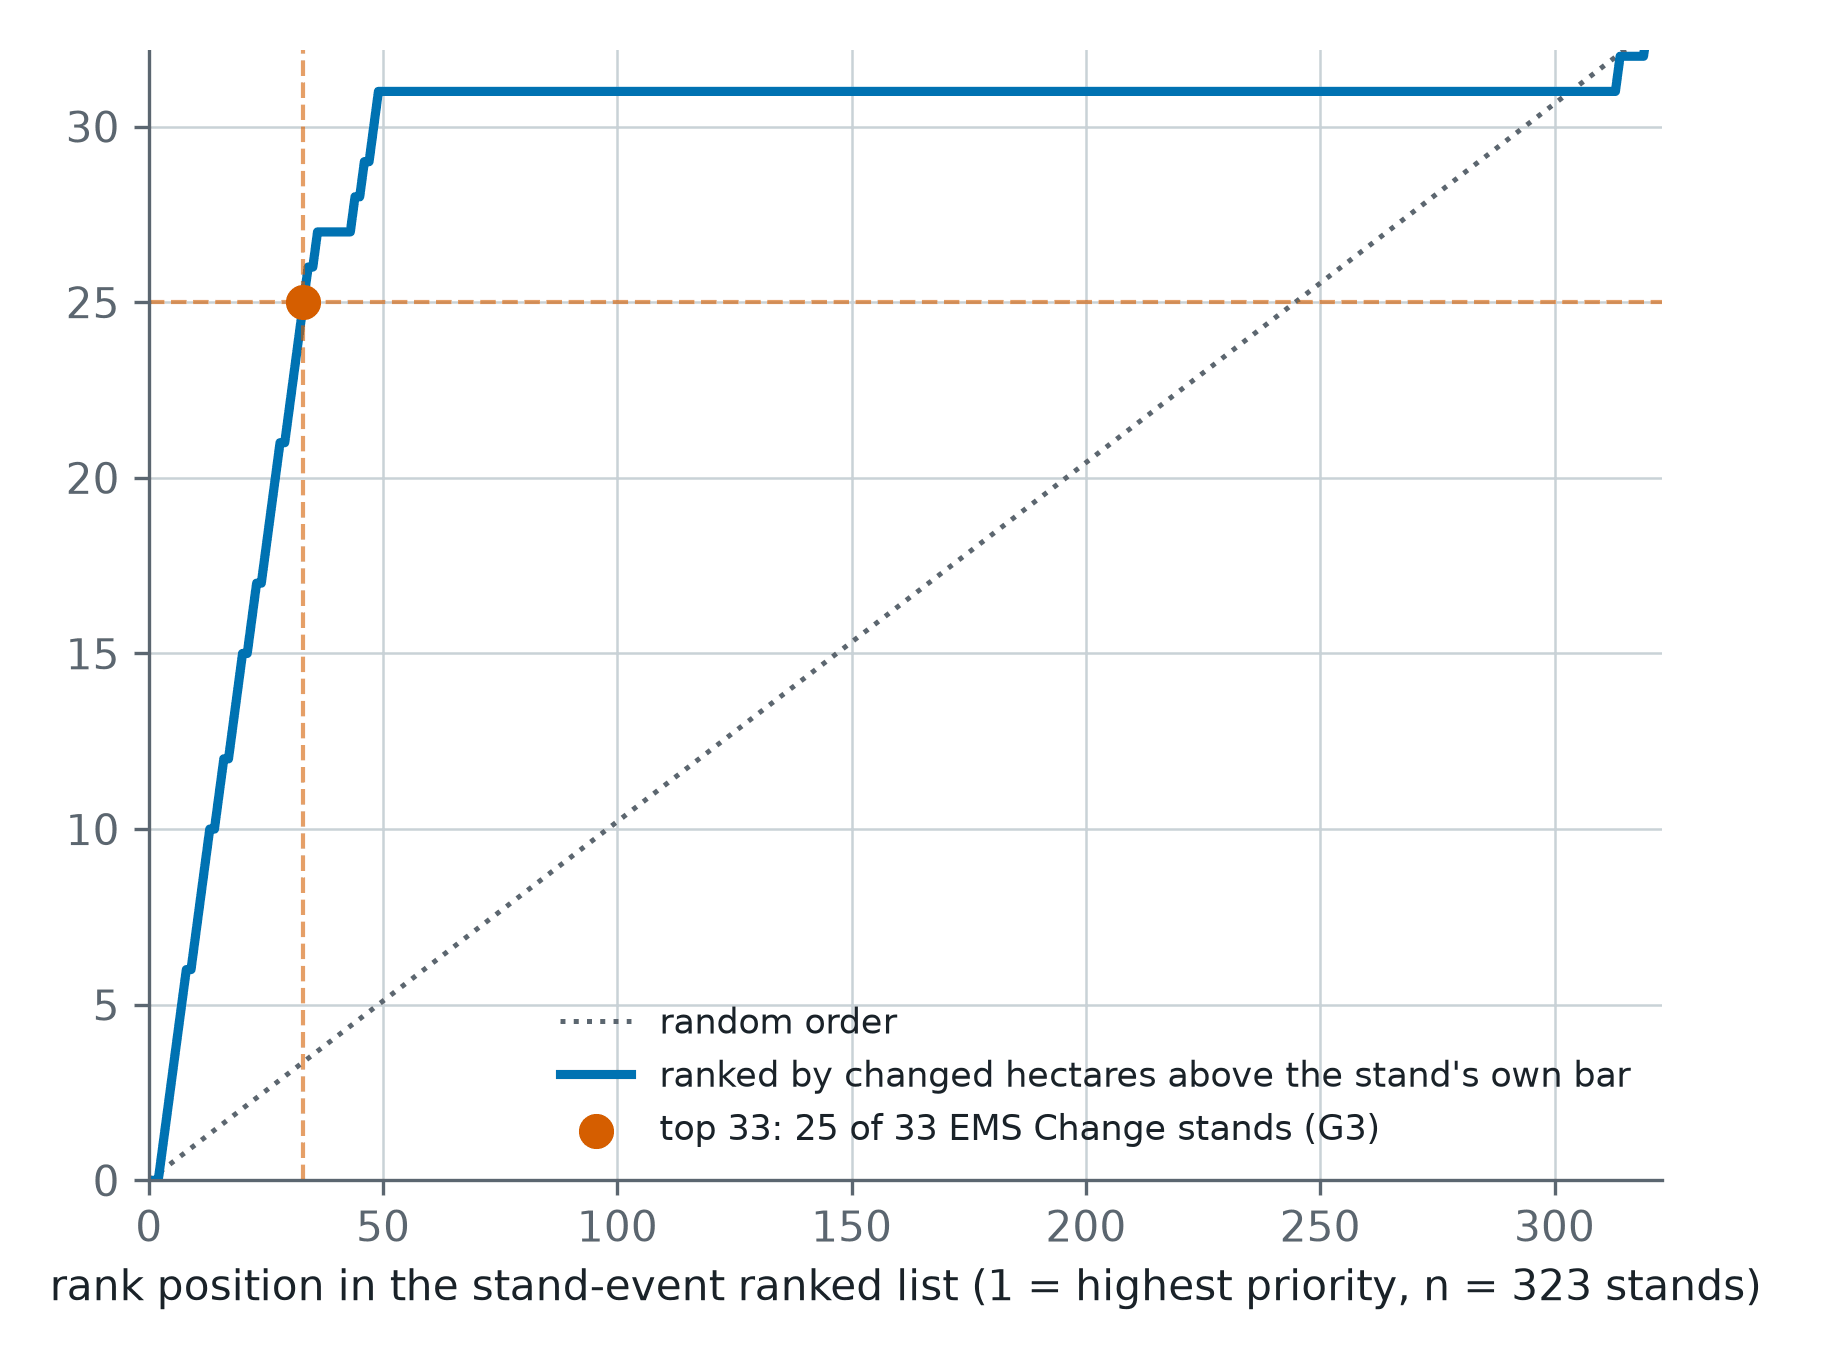
Storm Johannes Stand Ranking From Sentinel-1 and Sentinel-2 Across 323 Swedish Conifer Stands
A post-storm ranking of 323 one-hectare conifer stands in central Sweden, each read from Sentinel-1 and Sentinel-2 against its own quiet years and scored against Copernicus EMS grading.
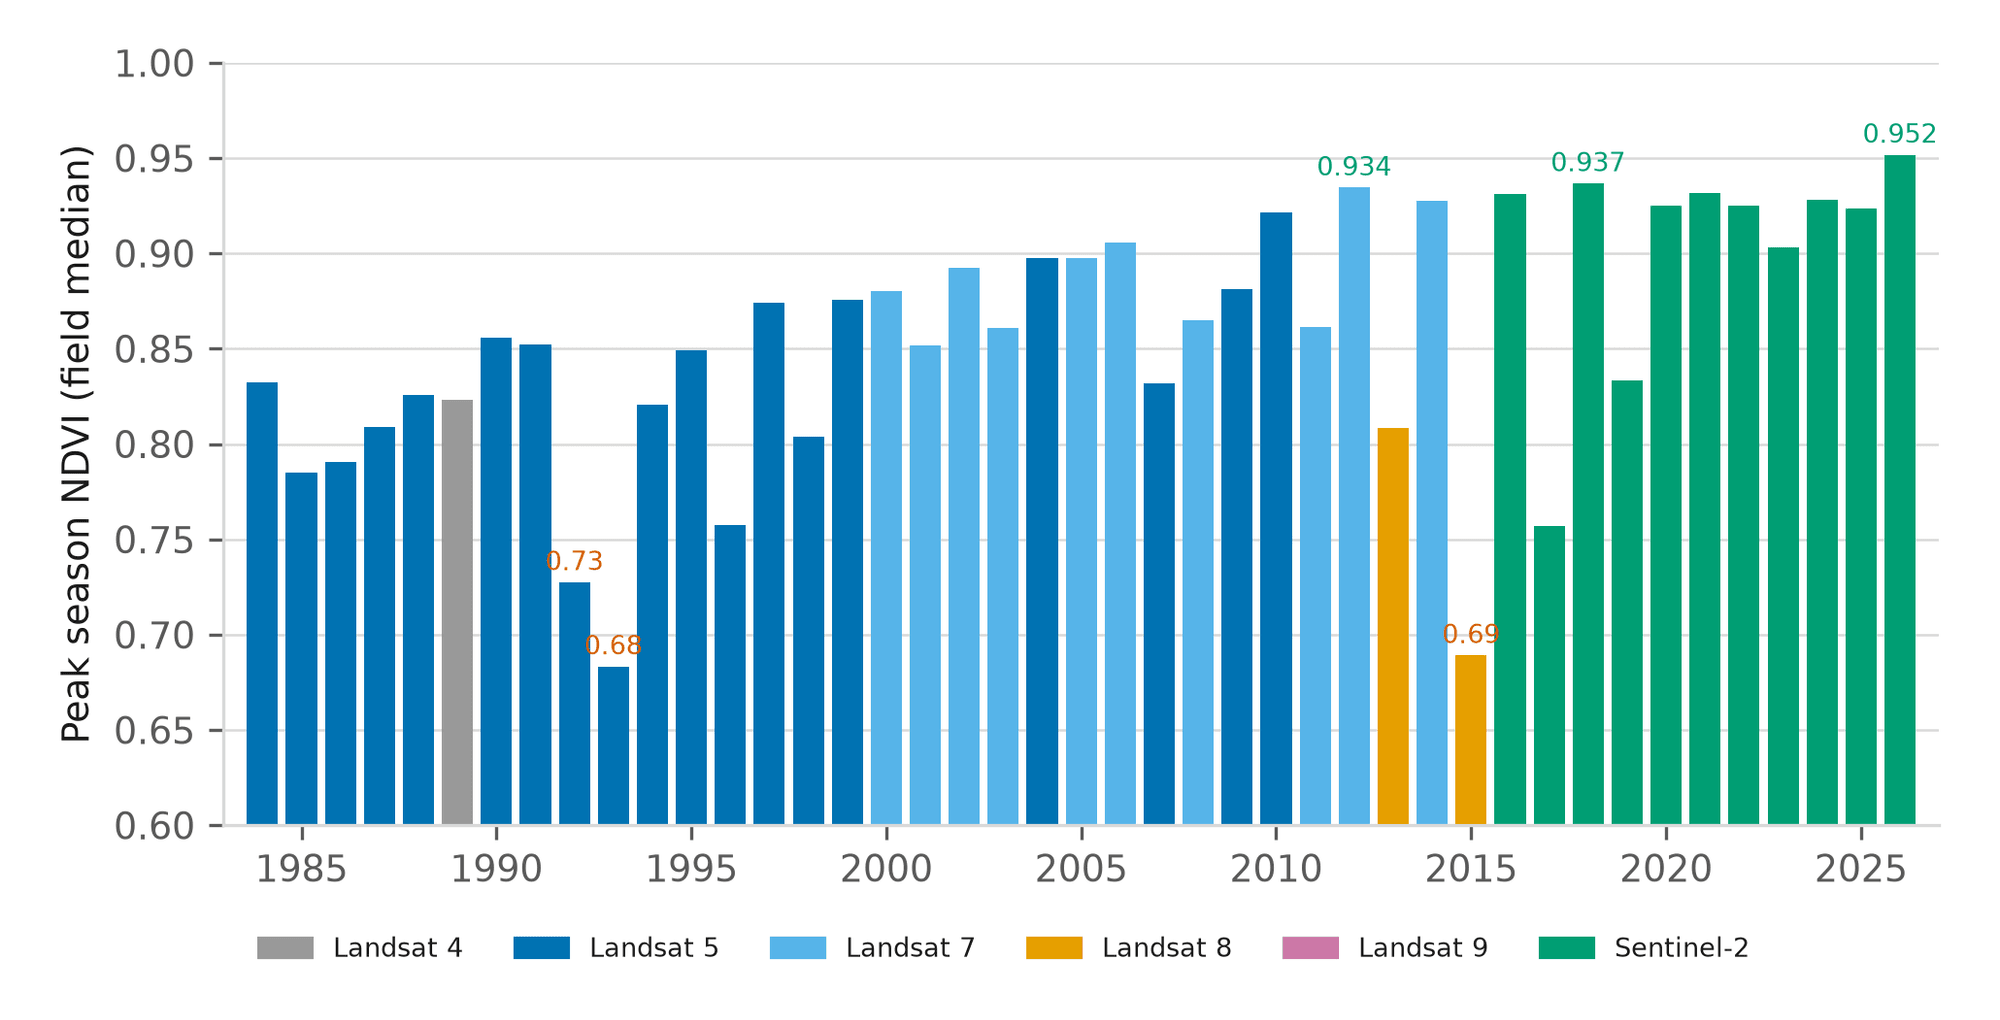
Forty-Three Seasons of a Nebraska Pivot and Management Zone Delineation
A 43-year canopy baseline for one centre pivot near Seward, Nebraska, and a three-tier management zone map built from vegetation, terrain and radar moisture.
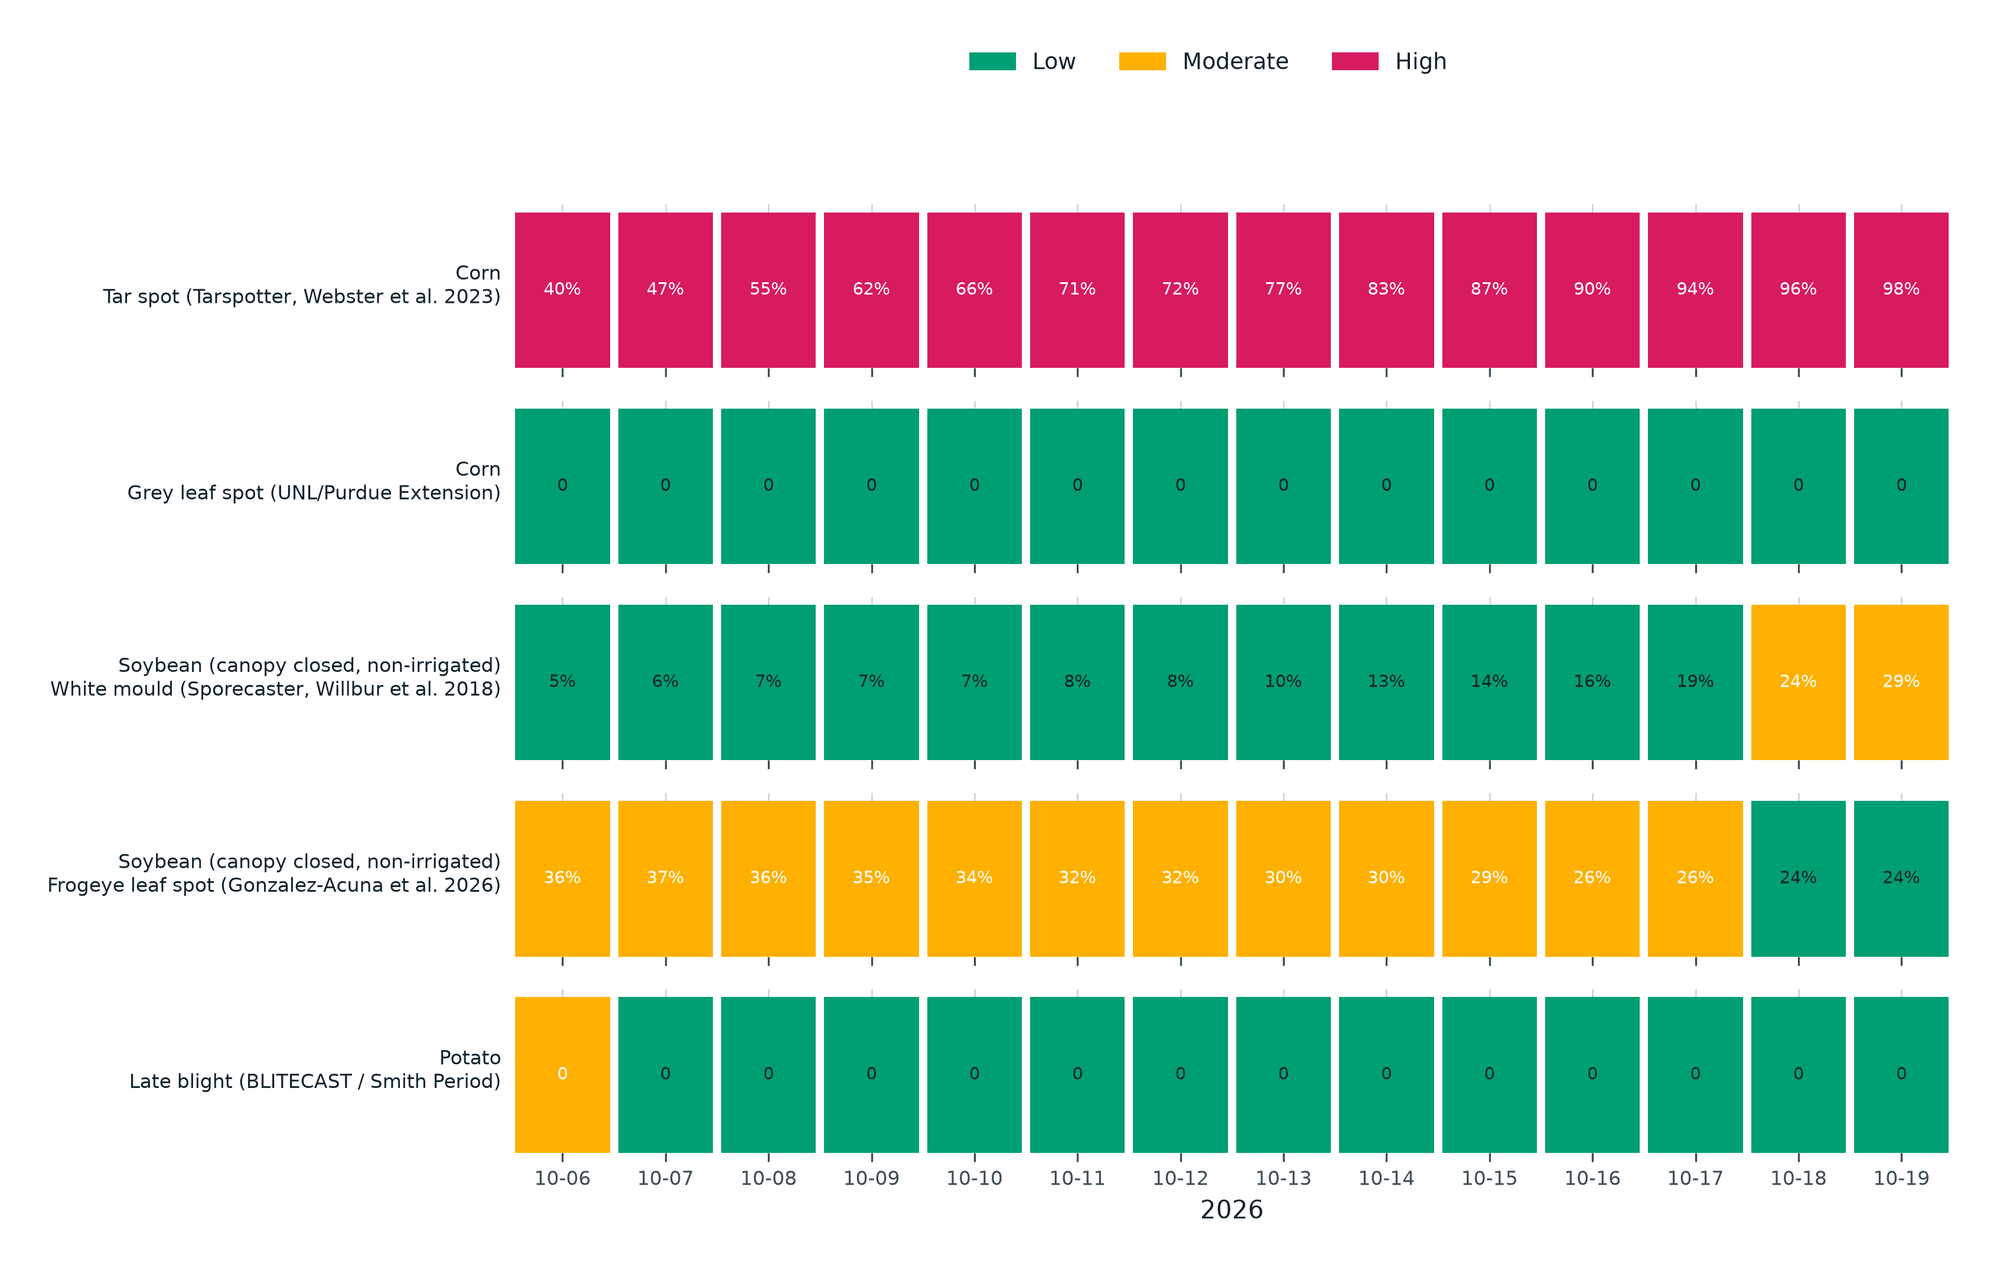
Season Brief and Fourteen-Day Disease Forecast for a Kansas Corn Pivot
A 184-day season brief for a 61-hectare corn pivot in western Kansas against its own 10-year normal, with five published disease models run on the field's own 14-day forecast.