
Measuring the 2022 Po Drought Rice Collapse Against Italy’s National Loss Survey
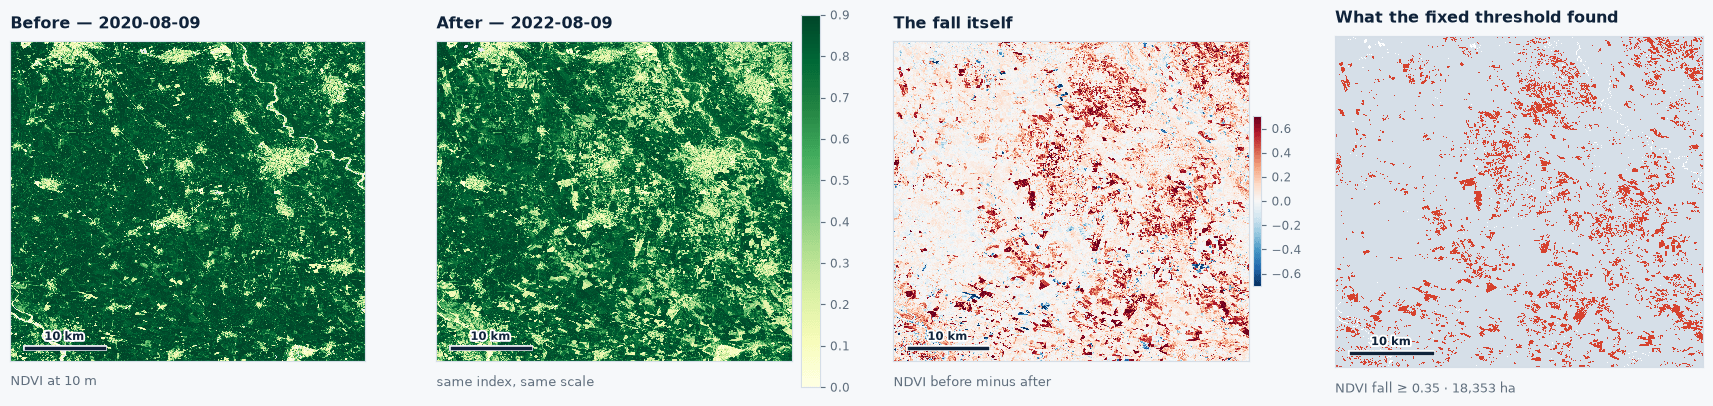
Canopy collapse across the Lomellina rice district in the 2022 Po drought, measured at the rice authority’s unproductive-field threshold against an unrestricted 2020 season.

- Location
- Lomellina, Pavia, and the Novarese fringe
- Area
- About 31 by 40 kilometres, 1,753 km² observed
- Record
- 2022 drought against 2020, 20 June to 9 August
- Deliverables
- Canopy loss maps at three thresholds, two-season control, survey comparison
The problem
Water was rationed across 300,000 hectares with no view of where the cuts were landing, and the official loss figures arrived in December.
What we did
Exact calendar date pairs against 2020, a year with no irrigation restrictions, scored at three thresholds including the rice authority’s definition of an unproductive field.
The result
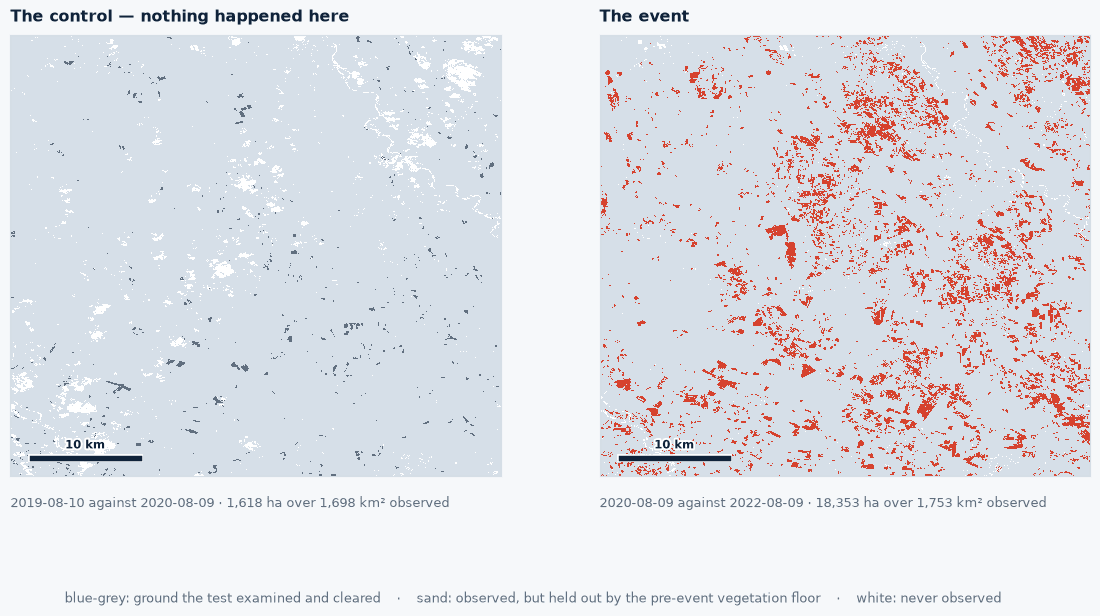
18,353 hectares at that threshold against 1,618 from two ordinary seasons, with the stress signal visible on 20 June, the week the cuts were ordered.
The Objective
Irrigation consortia rationing water and insurers settling drought claims need to know where the cuts are landing while the season can still be managed. On 24 July 2022 the Po at Pontelagoscuro ran at 104 cubic metres a second against a long term July mean of 832, the worst low flow on the river in two centuries. The basin authority ordered a 20 per cent cut in irrigation withdrawals on 20 June. The Est Sesia consortium, which serves about 300,000 hectares, was down to a third of its normal flow by June, and wetting turns stretched from every few days to as long as thirty five. Compensation turned on a per parcel test, damage above 30 per cent of ordinary gross saleable production, and the official loss figures arrived the following December.
Reference Year and Date Pairs
The analysis covers the Lomellina and the Novarese fringe on a box of about 31 by 40 kilometres. The box holds all four municipalities the rice authority names as worst hit in Lombardy and six of the eight it names in Novara.
- Reference year: 2020, when the Po’s annual mean was within 1 per cent of the long term average and no irrigation restrictions applied.
- Date pairs: 20 June, 20 July and 9 August in both years, exact calendar matches imaged from the same viewing geometry.
- Control: 2019 against 2020 on matched dates, same box, same thresholds.
- Thresholds: crop stress, an intermediate tier, and the rice authority’s own definition of an unproductive field.
- Minimum patch: connected patches of half a hectare and larger.
The reference year carries most of the weight in the method. 2021 was itself a drought year in this district: Est Sesia cut deliveries 35 per cent that June and the Po ran 39 per cent below normal from April to June. Two of the three dates are the dates the rice authority used for its own measurement, and the survey comparison is made at the authority’s threshold.
Canopy Collapse Findings
At the rice authority’s unproductive-field threshold, the drought separates cleanly from two ordinary seasons.
- 20 July 2022 against 20 July 2020: 17,779 hectares, 10.2 times the July control of 1,746 hectares.
- 9 August 2022 against 9 August 2020: 18,353 hectares, 11.3 times the August control of 1,618 hectares.
- 9 August at the crop stress threshold: 38,489 hectares, 9.5 times the control.
- 9 August at the intermediate threshold: 26,028 hectares, 10.9 times the control.
The separation strengthens as the test gets stricter, rising from 9.5 to 10.9 to 11.3 times the control.
Comparison With the Rice Authority Survey
Ente Nazionale Risi ran a satellite classifier calibrated on ground checks and the farms’ own aid declarations, and published hectares lost by district.
- This study, 9 August pair at the unproductive-field threshold: 18,353 hectares.
- Ente Nazionale Risi, Lombardy survey: 12,159 to 13,581 hectares, 22 to 24 per cent of 55,908 hectares.
- Ente Nazionale Risi, Novara survey: 3,027 hectares, 10 per cent of 29,207 hectares.
- Combined published figure for the two districts: 15,186 to 16,608 hectares.
- ISTAT rice production, 2021 to 2022: Lombardy down 28.2 per cent, Piedmont down 5.4 per cent.
The measured figure sits about 12 per cent above the top of the survey range, consistent with coverage: the analysis box is a superset of the declared rice parcels and includes maize, which fell 24.7 per cent in Lombardy the same year.
Operational Utility
The 20 June pair already shows 51,684 hectares of stressed crop, the same week the basin authority ordered its cut and six weeks before the rice authority’s key scene. A consortium targets rationing on that map while there is still a season to save, and an insurer reads district level loss months before the official figures, from six archive scenes with no tasking and no field campaign. A parcel register laid over the same output narrows the reading from district to holding, the form a claims process requires, with high-resolution imagery via our partner SkyFi where parcel detail matters. The record measures canopy loss against a normal year; tonnes and claim value are derived with the crop, the parcel boundary and an agronomic model.
Run this on your own ground
Draw an area of interest, pick the dates, and the same analysis runs against the archive over your sites.
References
- Ente Nazionale Risi, damage survey of the 2022 rice crop, Il Risicoltore nos. 9 and 10, 2022.
- Ente Nazionale Risi (2023). Riso: evoluzione di mercato e sue prospettive. Presented at MASAF, 11 December 2023.
- Autorità di bacino distrettuale del fiume Po, Osservatorio permanente sugli utilizzi idrici, 2022 bulletins. adbpo.it
- ISTAT, L'andamento dell'economia agricola, anno 2022, 12 June 2023.
- Montanari A., Zanchettin D. et al. (2023). Why the 2022 Po River drought is the worst in the past two centuries. Science Advances 9(32). doi.org/10.1126/sciadv.adg8304
- Joint Research Centre (2022). Drought in northern Italy, March 2022. Global Drought Observatory analytical report, EUR 31037 EN.
More case studies
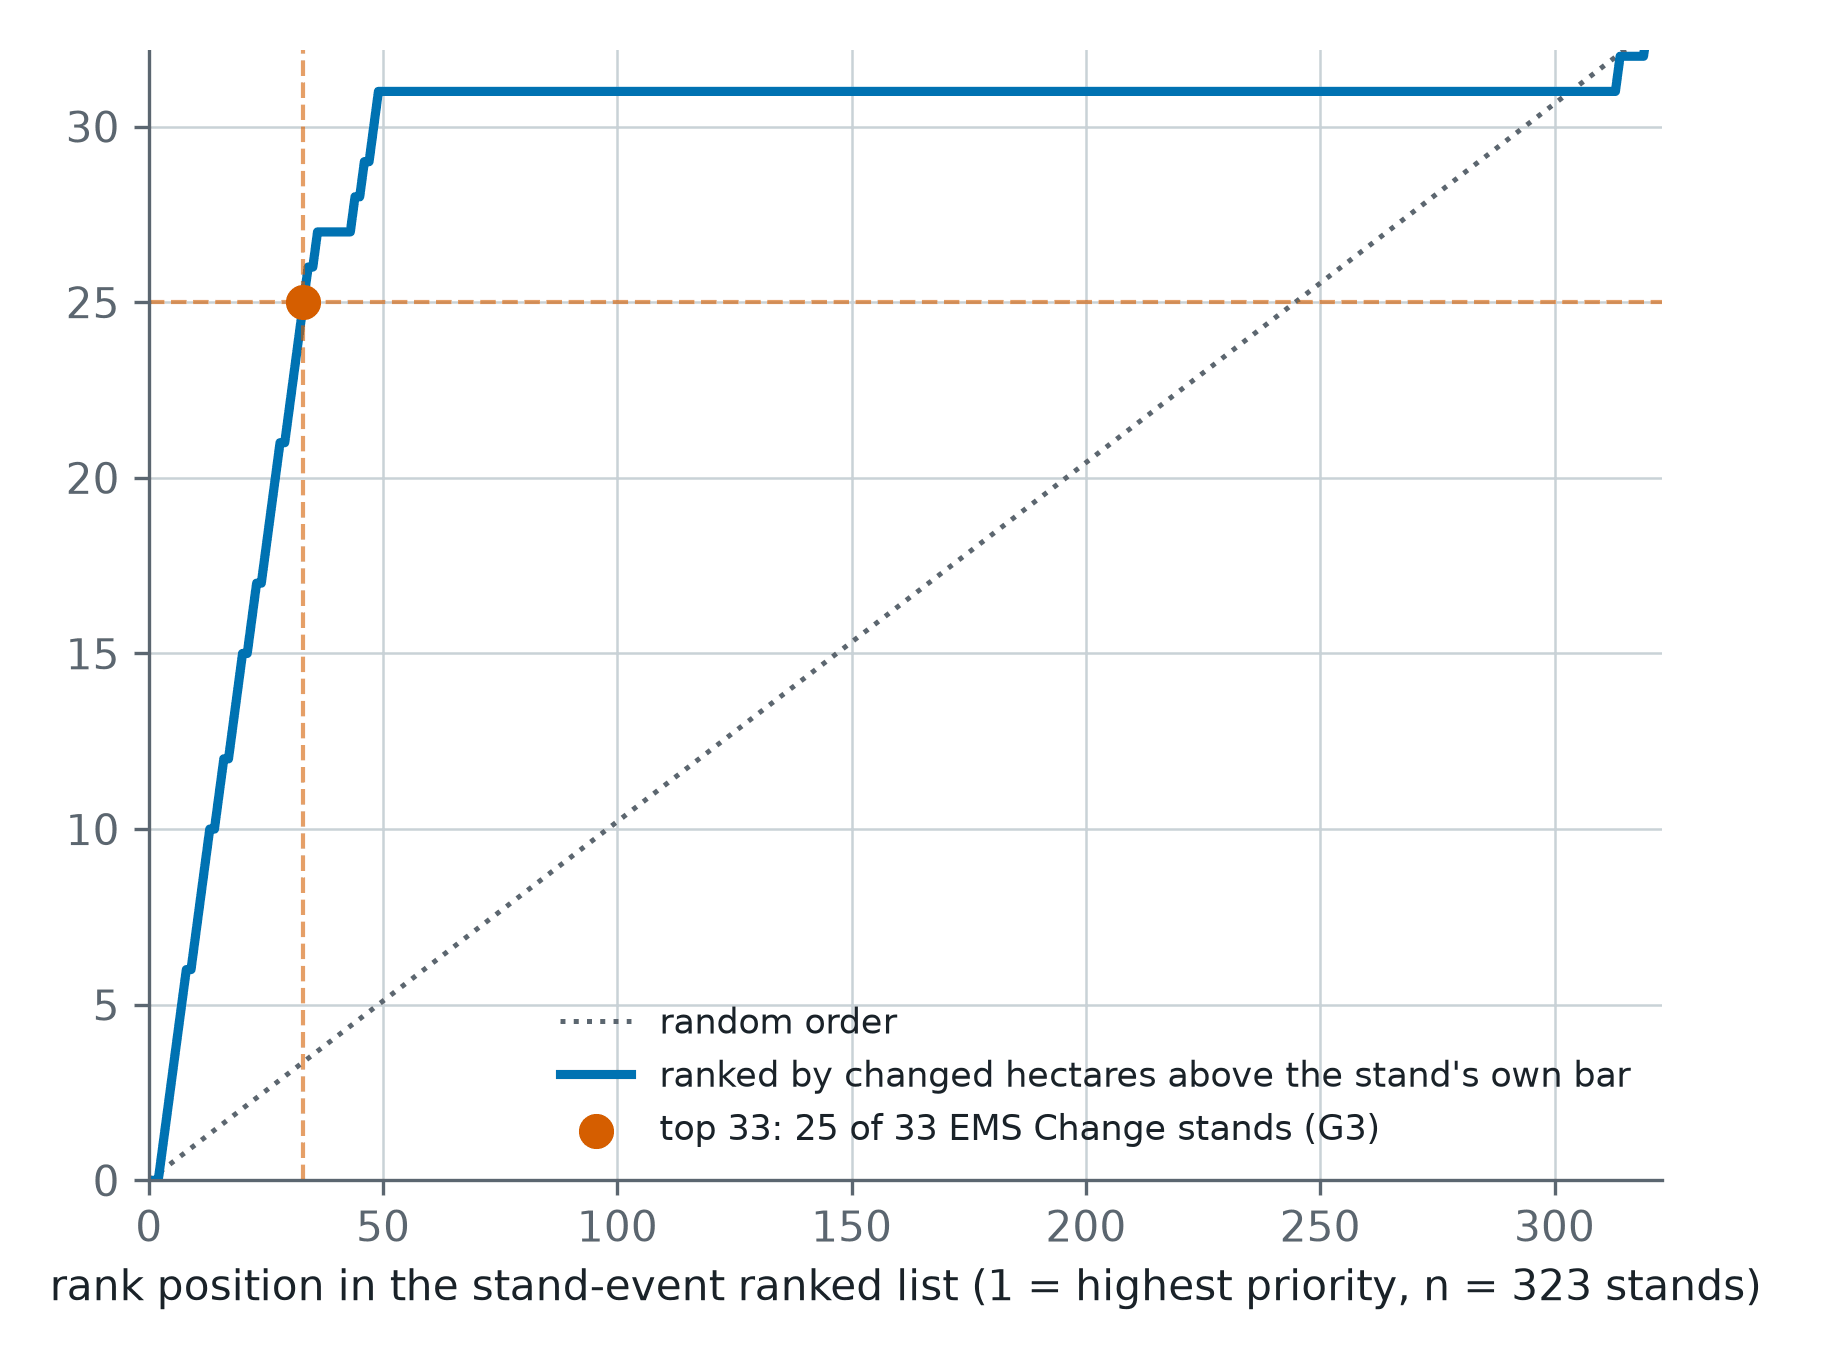
Storm Johannes Stand Ranking From Sentinel-1 and Sentinel-2 Across 323 Swedish Conifer Stands
A post-storm ranking of 323 one-hectare conifer stands in central Sweden, each read from Sentinel-1 and Sentinel-2 against its own quiet years and scored against Copernicus EMS grading.
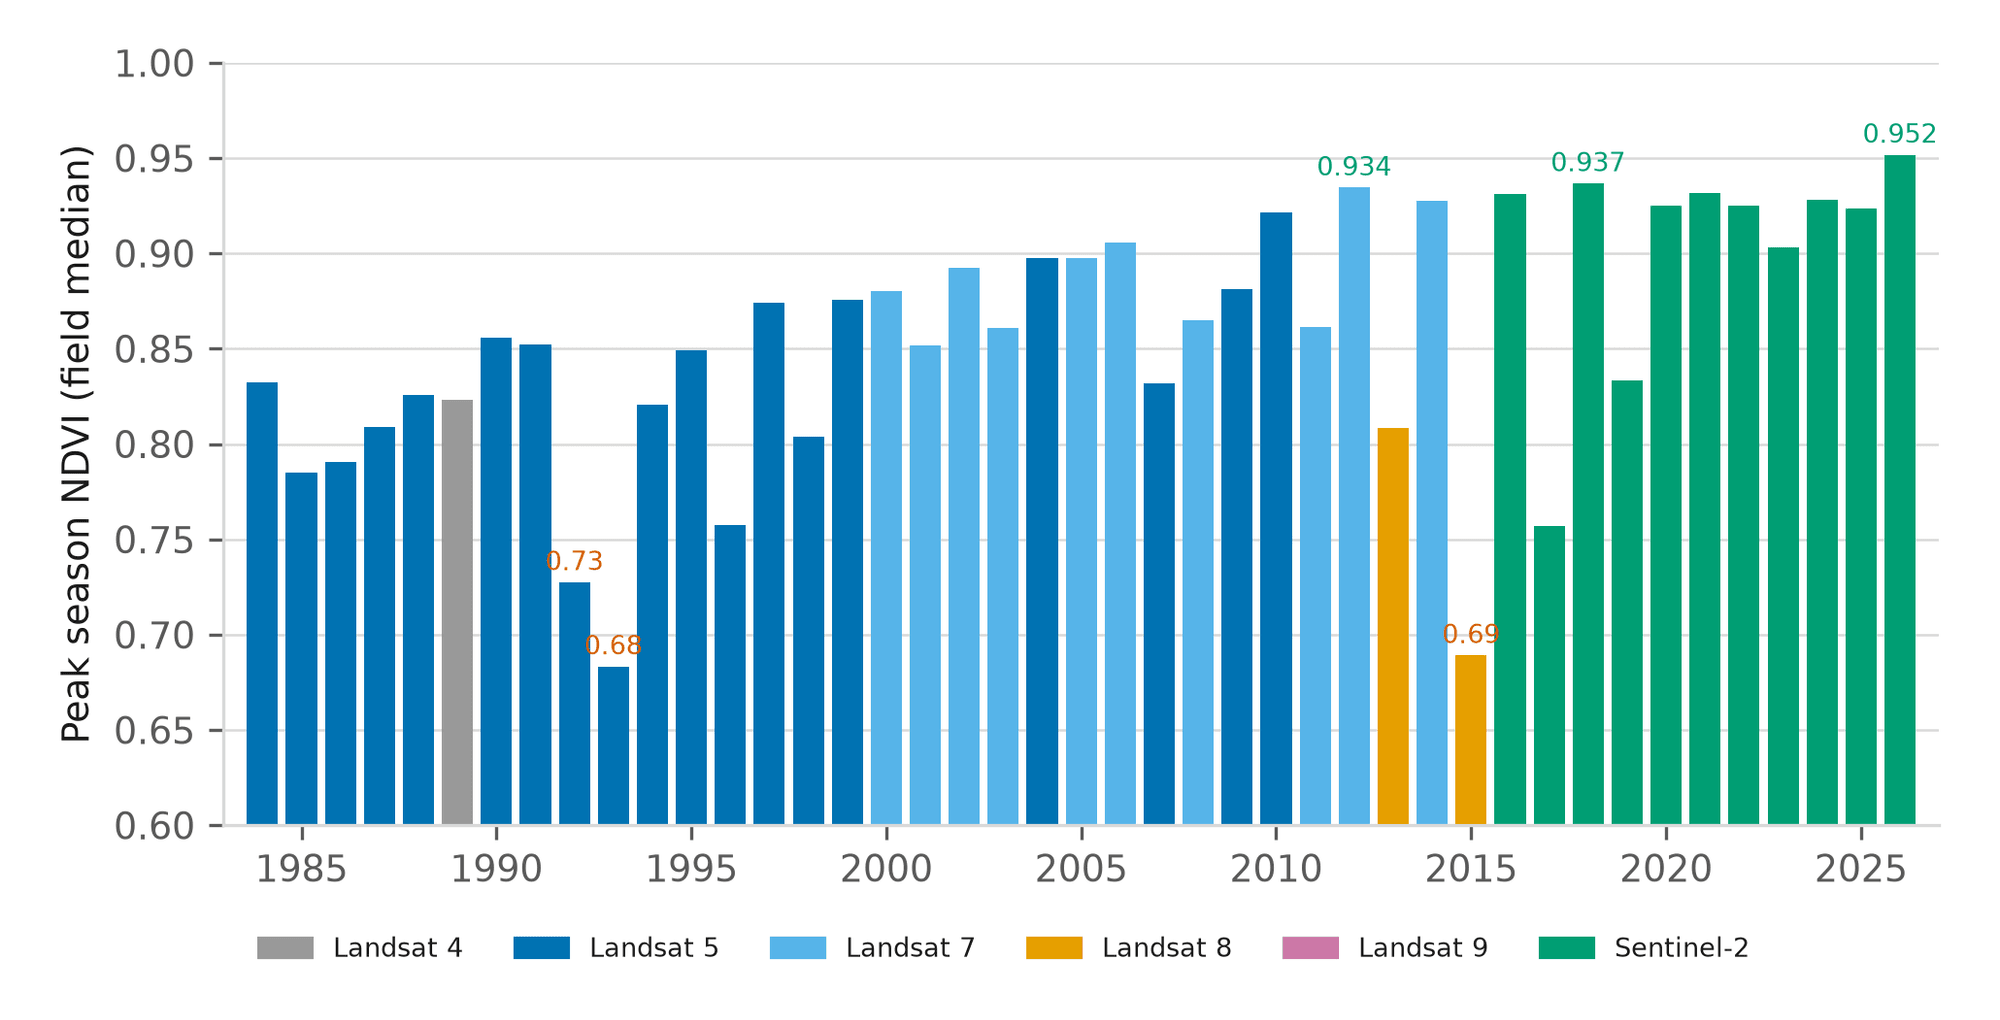
Forty-Three Seasons of a Nebraska Pivot and Management Zone Delineation
A 43-year canopy baseline for one centre pivot near Seward, Nebraska, and a three-tier management zone map built from vegetation, terrain and radar moisture.
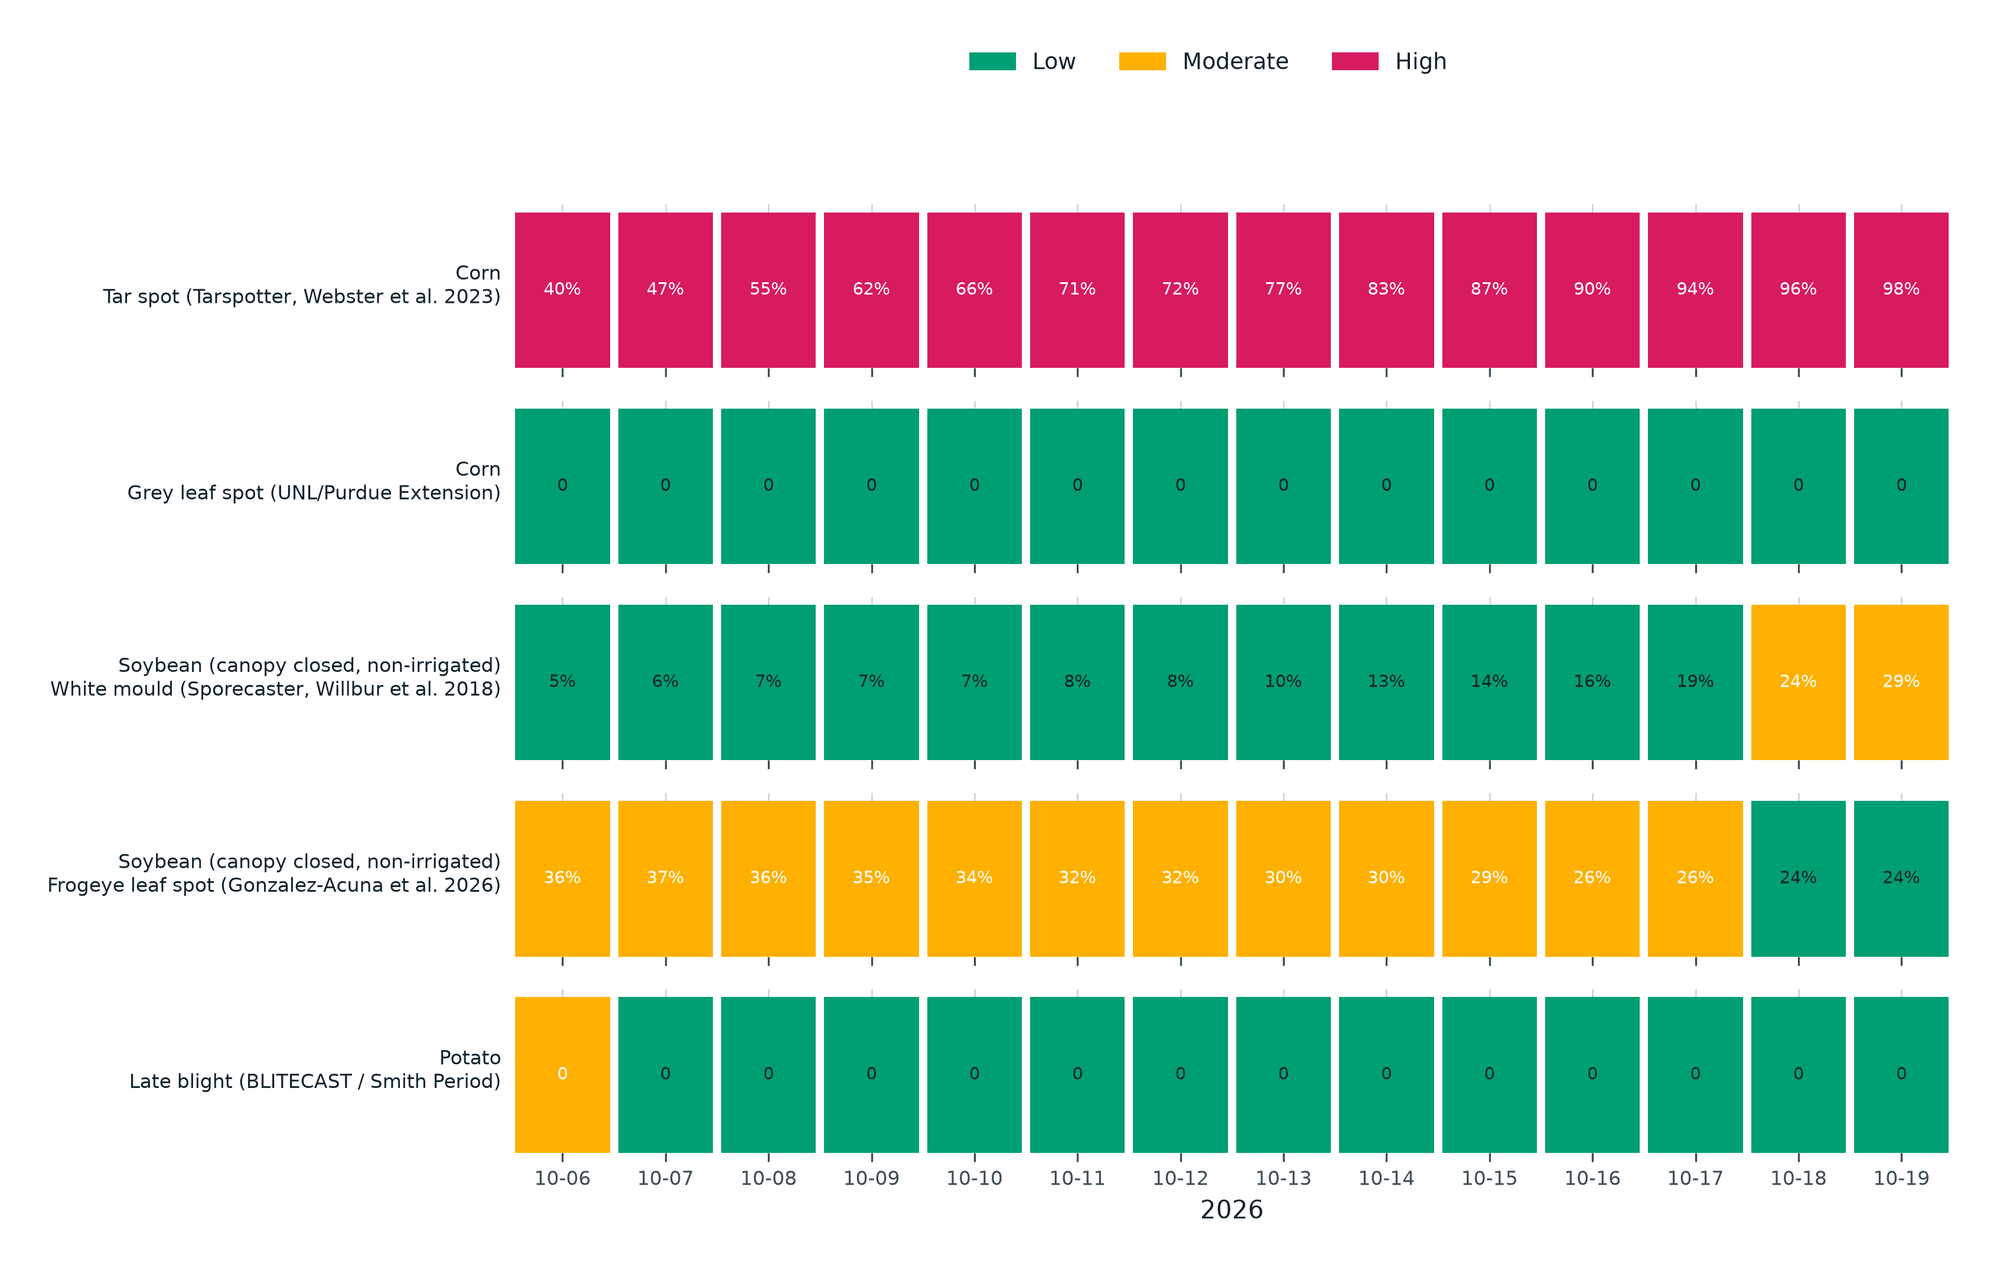
Season Brief and Fourteen-Day Disease Forecast for a Kansas Corn Pivot
A 184-day season brief for a 61-hectare corn pivot in western Kansas against its own 10-year normal, with five published disease models run on the field's own 14-day forecast.