
43-year field history
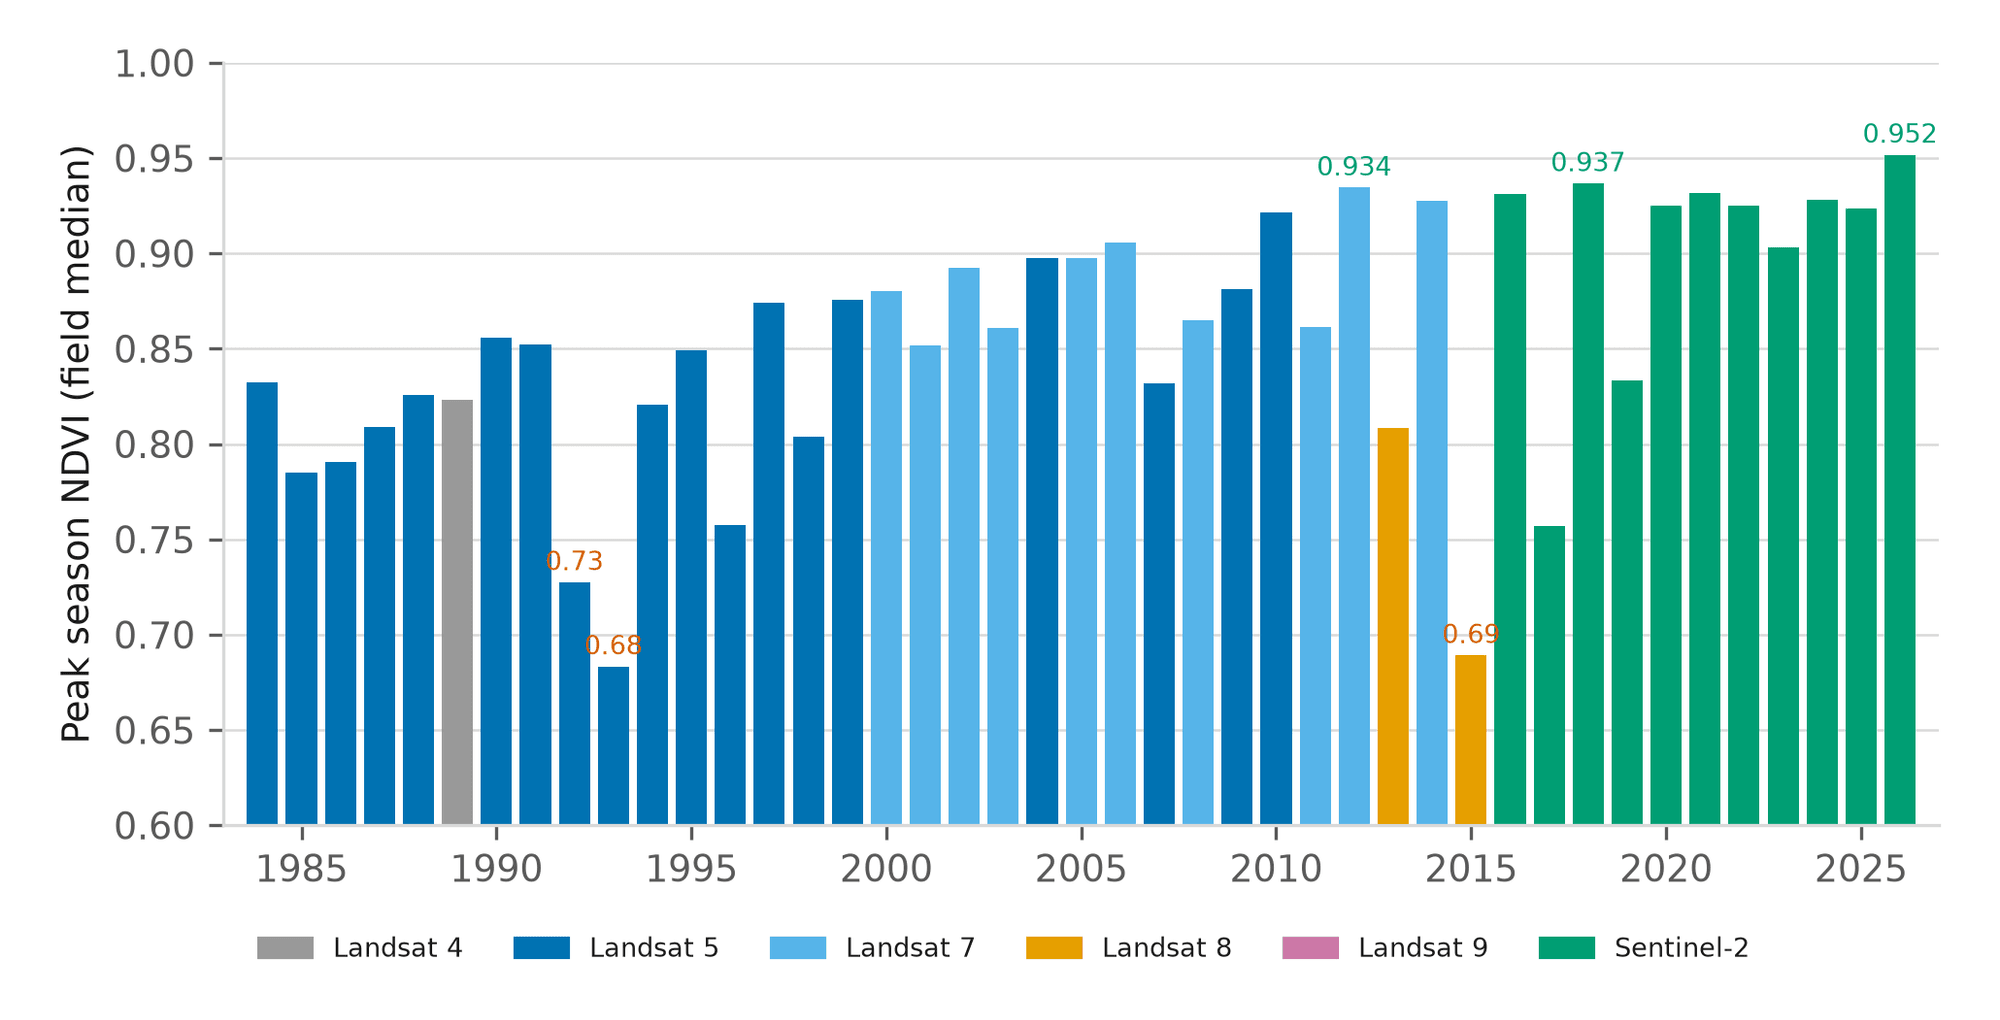
Every registered field gets its history back to 1984: one bar a year for the season’s peak canopy, with the highest and lowest years named. It is the baseline the weekly status reads against, and a record a consultant can show a landlord or a lender.
For the same buyers as the register, and for anyone asked how a field has done over the years.
- Record from
- 1984
- Read
- Once, when the field is registered
01 · The order
What you send, and what comes back
You send
- Nothing extra. The history is read when a field is registered
You receive
- A bar per season from 1984, each naming the Landsat or Sentinel-2 sensor it came from
- The highest and lowest seasons named
- The chart inside the field record PDF
02 · How it is read
From the open archive to the record
Public sources
- 01
Each bar is the season’s peak, read only from looks that were clear across the whole field.
- 02
Landsat carries the years before 2016 and Sentinel-2 the years since. Every bar says which sensor it came from.
03 · The record behind it
What it has been measured against
Each figure is printed with its denominator and scope in the paper it links to.
- 43 of 43
- seasons with a reading for one Nebraska centre pivot, 1984 to 2026
A weekly field record from forty-three years of open imagery, Axine Labs, 2026
More in Agriculture
Field register and weekly record
One clear look a week for every field, read against its own earlier seasons and marked steady or moved.
Management zones
Split a field into three to five zones from its own last several seasons, and attach a rate per zone for export.
Scouting app
The field register on a phone: this week’s status, tasks and photos pinned to the field, and work that keeps going offline.
White label editions
The field record under your own name, with a workspace for each grower you serve and every record issued by you.
Crop classification
What crop stood on an area in a season, as a map and as parcels, with your own field truth taking precedence where you have it.
Land cover classification
An area classified into ESA WorldCover classes for a chosen season, and what changed between two periods.
Send us twenty fields
Send twenty field boundaries. The record comes back within 48 hours as a PDF with the layers, and the rest of your book can run under your own name.