
PERFIL DE SECTOR · AGRICULTURA Y SALUD DEL SUELO
Capas de suelo, tomadas mientras el terreno está desnudo.
Tome un bloque de campos y reciba cobertura de residuos, clase de labranza, profundidades de absorción de arcilla y yeso, y un índice relativo de materia orgánica sobre compuestos de suelo desnudo.
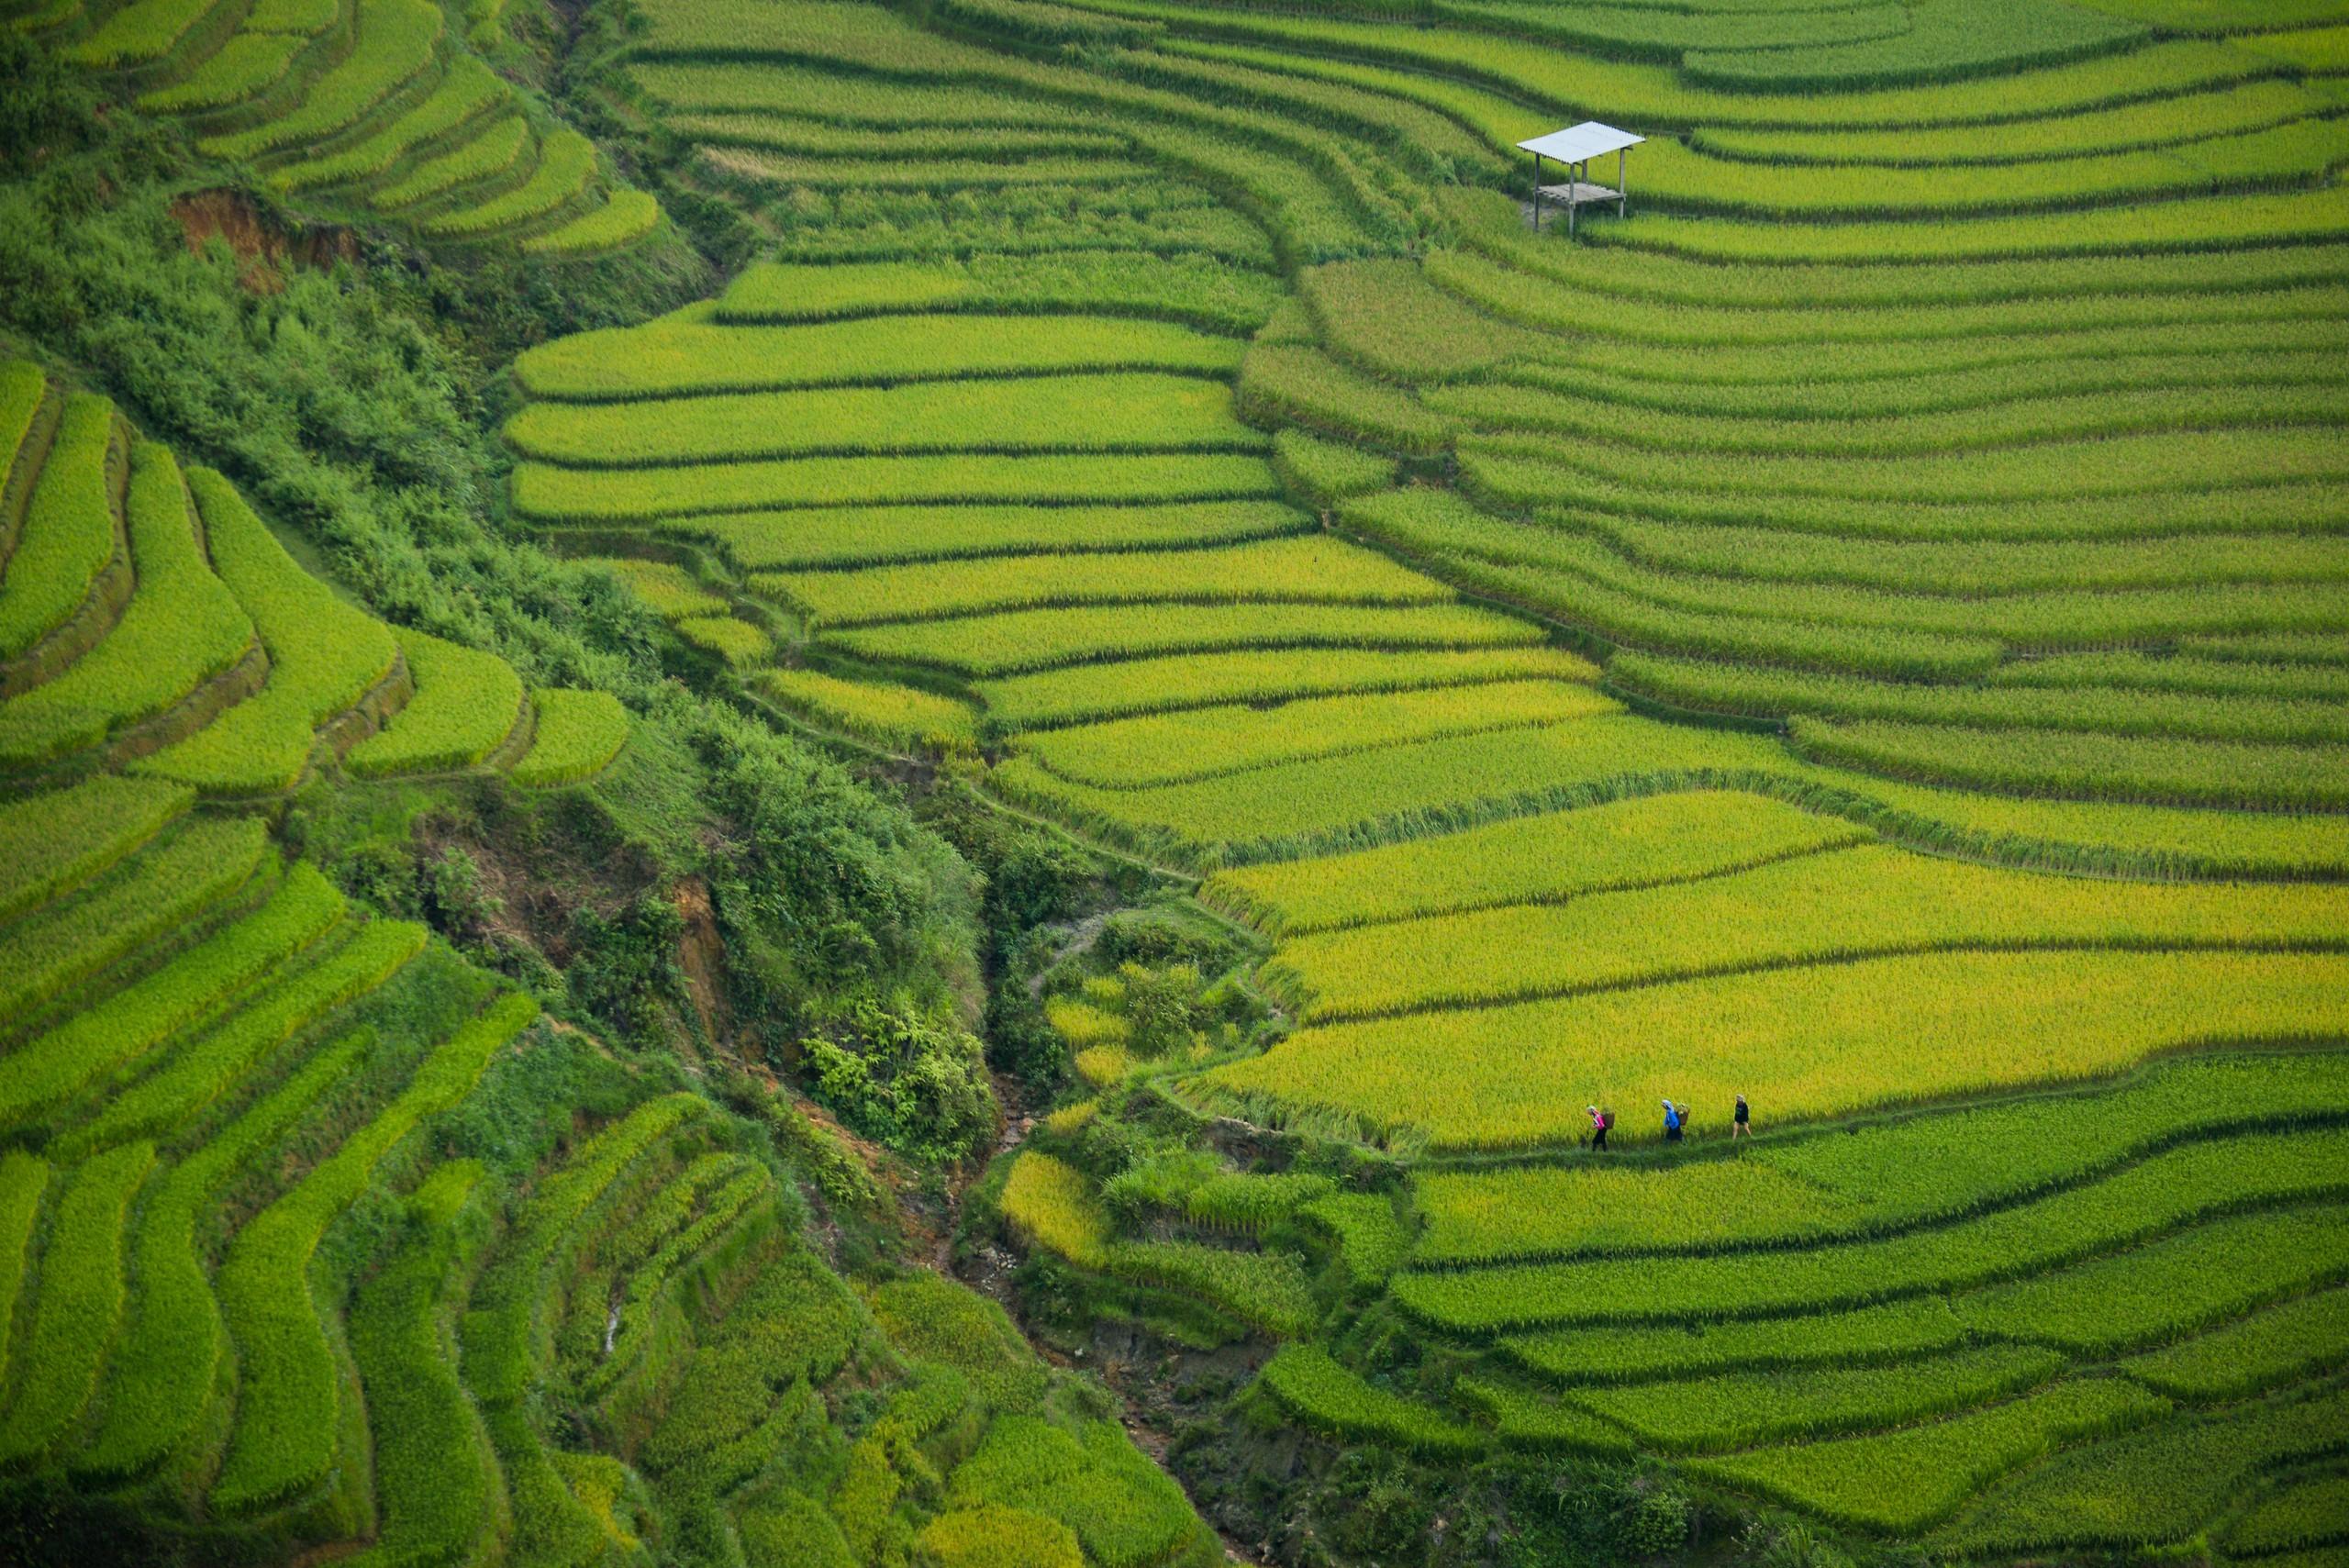
What people bring us, and how we handle it.
Verificar la cobertura de residuos en todo un condado
En imágenes de color, el rastrojo meteorizado y el suelo mineral desnudo se ven iguales.
La firma de celulosa del rastrojo seco ordena los campos por cobertura de residuos, algo que el verdor de banda ancha no puede ver.
Decidir dónde colocar sus núcleos de suelo
El muestreo en malla cuesta mucho por punto e interpola mal entre ellos.
El compuesto de suelo desnudo a lo largo del archivo le da un índice relativo sobre el campo, suficiente para ubicar núcleos. No se reporta contenido de carbono.
Captar la salinidad antes de que cueste una temporada
La salinización suele notarse solo después de que el rendimiento cayó y el suelo formó costra.
La hidratación del yeso y las firmas de arcilla se leen juntas sobre suelo desnudo y seco, cribando la salinidad antes de que se muestre en el rendimiento.
WORKED EXAMPLE
Case study: Auditoría de labranza de conservación en el cinturón maicero de Iowa
Cobertura fraccional de residuos de cultivo y mapeo de suelo superficial desnudo en la cuenca agrícola del lóbulo de Des Moines.
Compuesto en la ventana de suelo desnudo
Escenas previas a la siembra tomadas en condiciones de superficie seca, compuestas al momento en que cada píxel estuvo más expuesto.
Índice de absorción de celulosa
Profundidad de absorción de celulosa, leída contra su línea base local.
Clasificación de labranza
Parcelas clasificadas en labranza de conservación por encima del treinta por ciento de residuos, y labranza convencional por debajo.
Lo que usted recibe
Fracciones de residuos y clases de labranza a nivel de parcela, con la fracción evaluable declarada por campo.
APPLICABLE SOLUTIONS
Layers that fit this sector.
Ready to run over your area, with no configuration step in between.
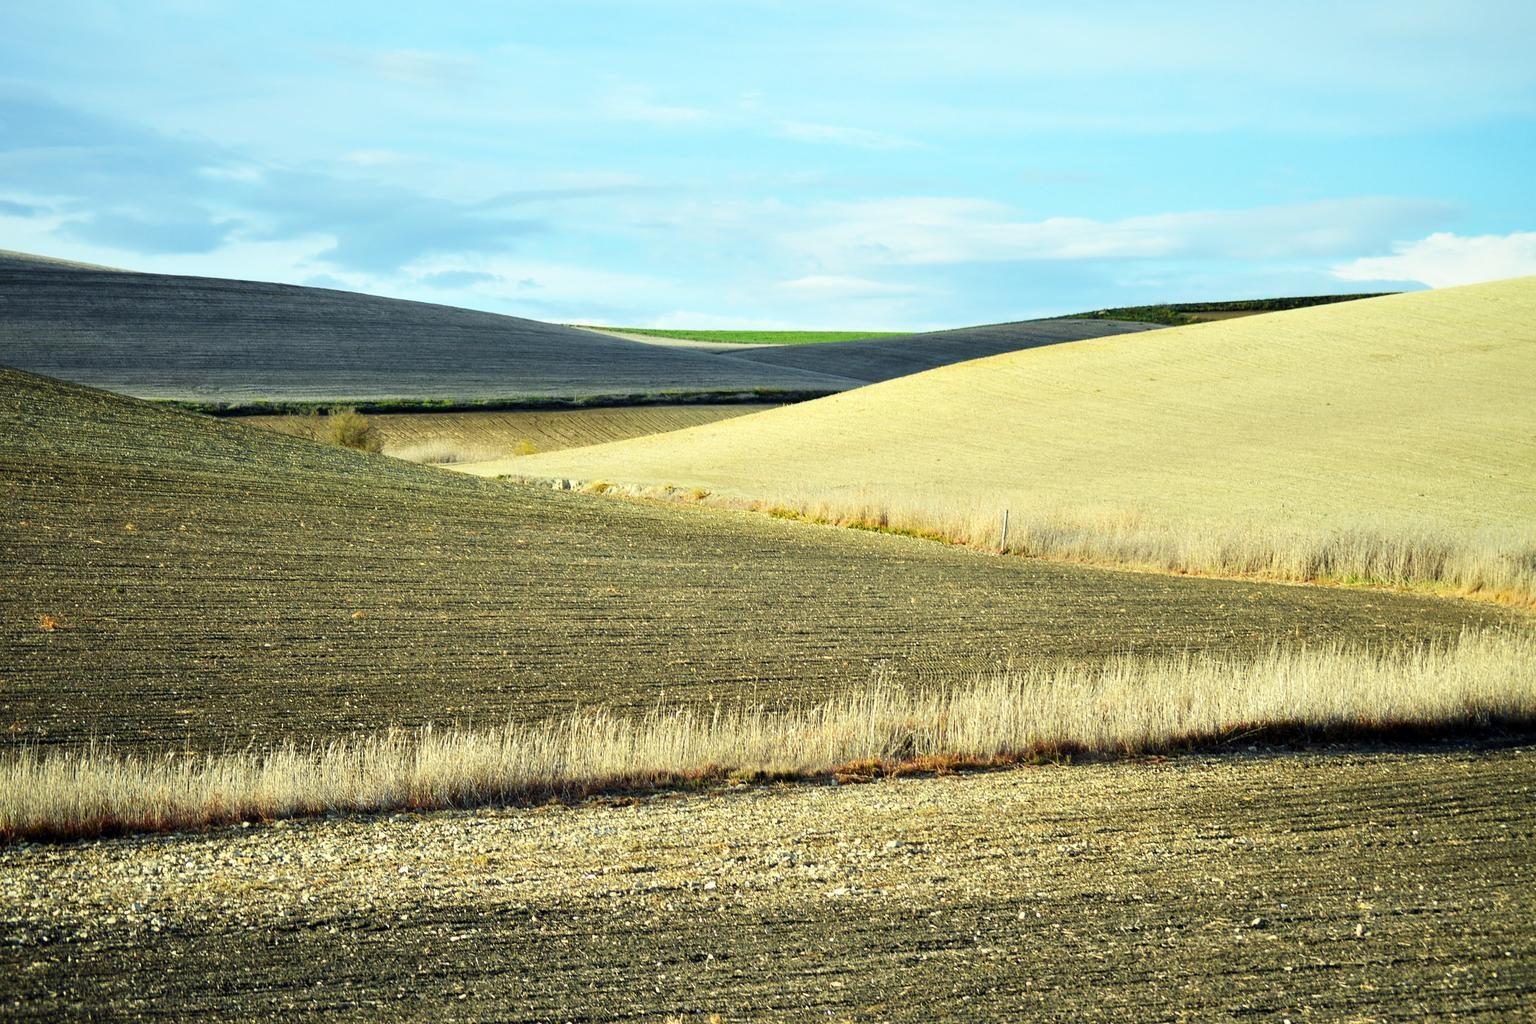
Exposición del Suelo y Residuos de Cultivo
Cobertura de residuos de cultivo y arcilla superficial, para clases de residuos y labranza.
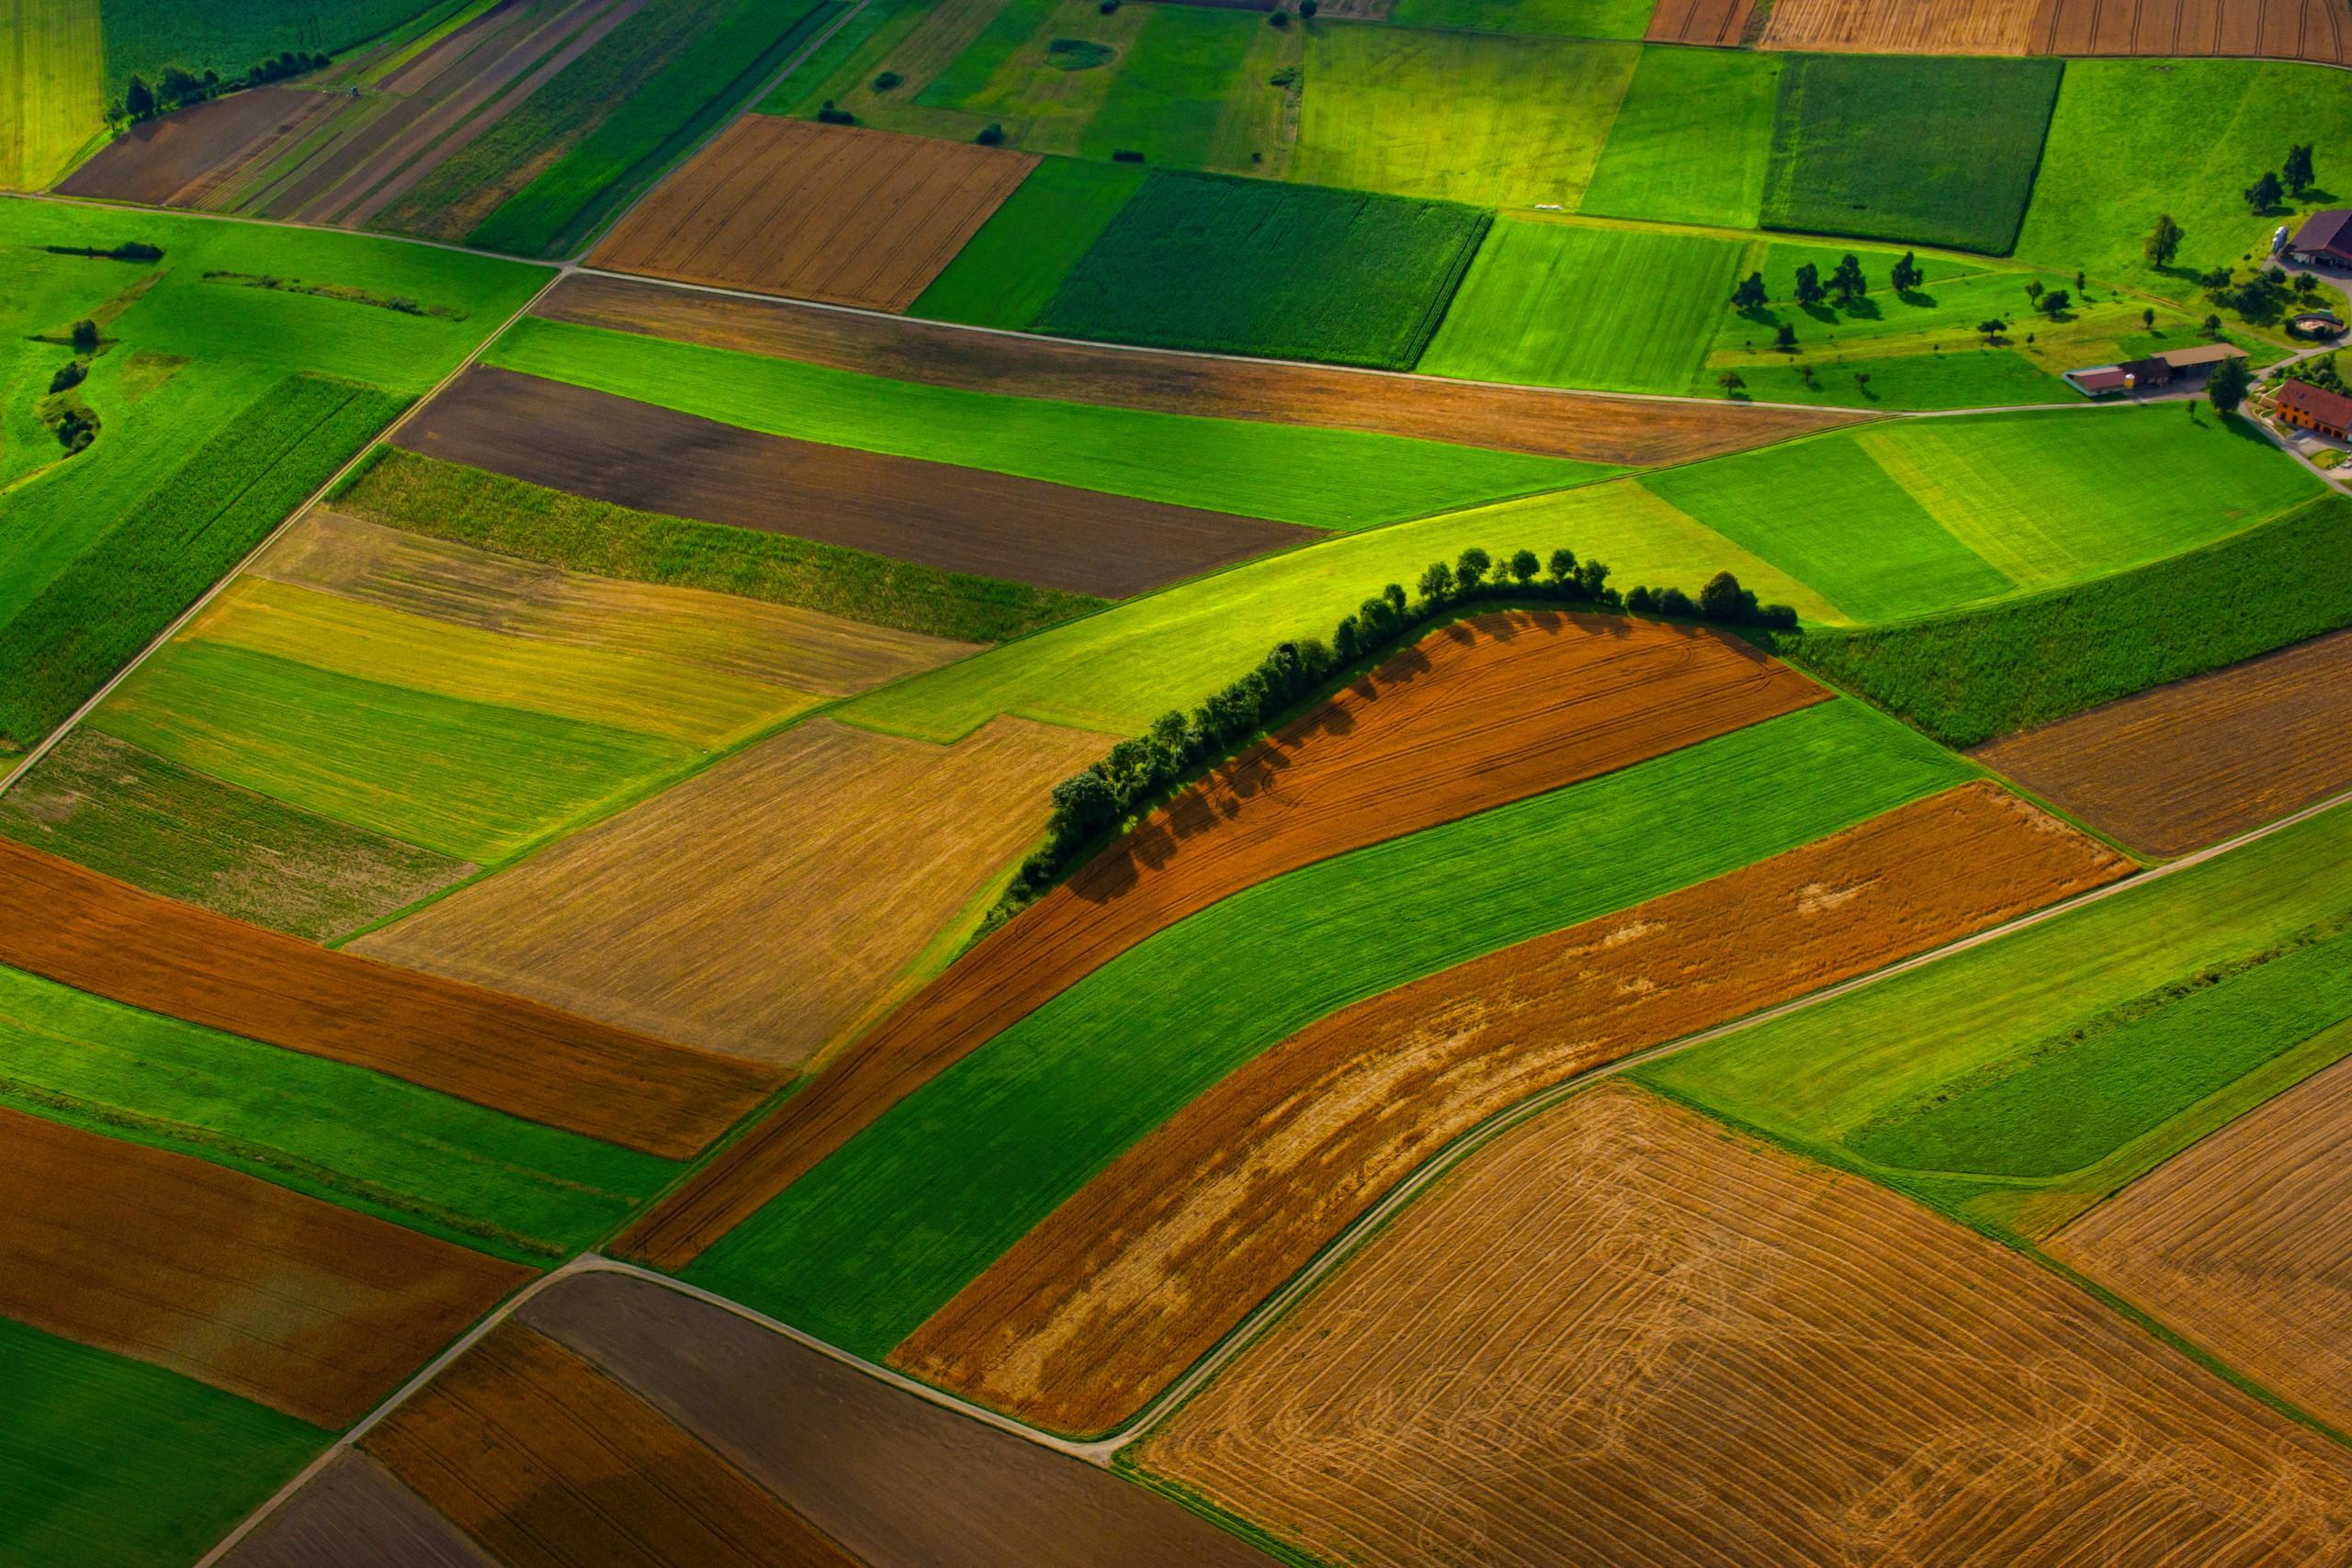
Proxy de Carbono Orgánico del Suelo
Cada píxel se compone al momento en que estuvo más expuesto y luego se clasifica por materia orgánica. No se reporta contenido de carbono.
Índice de Arcilla y Salinidad del Suelo Superficial
Lecturas de yeso y arcilla sobre suelo desnudo. La sal misma es invisible para el sensor, así que la salinidad solo se infiere de lo que la acompaña.
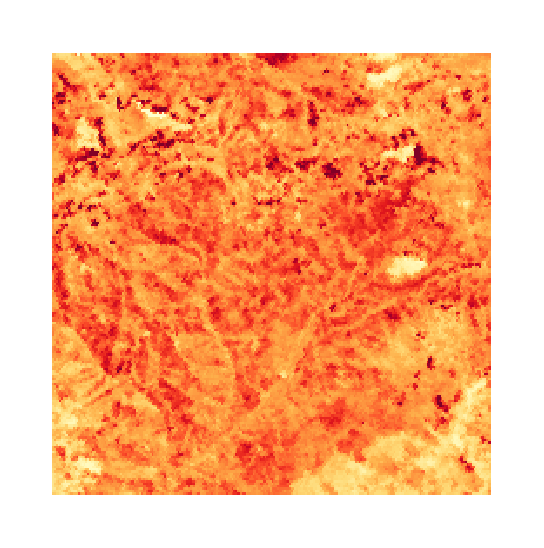
Clorofila del Dosel y Borde Rojo
Posición del borde rojo, que sigue el pigmento del dosel. Se rechaza en sensores que no pueden resolverla.
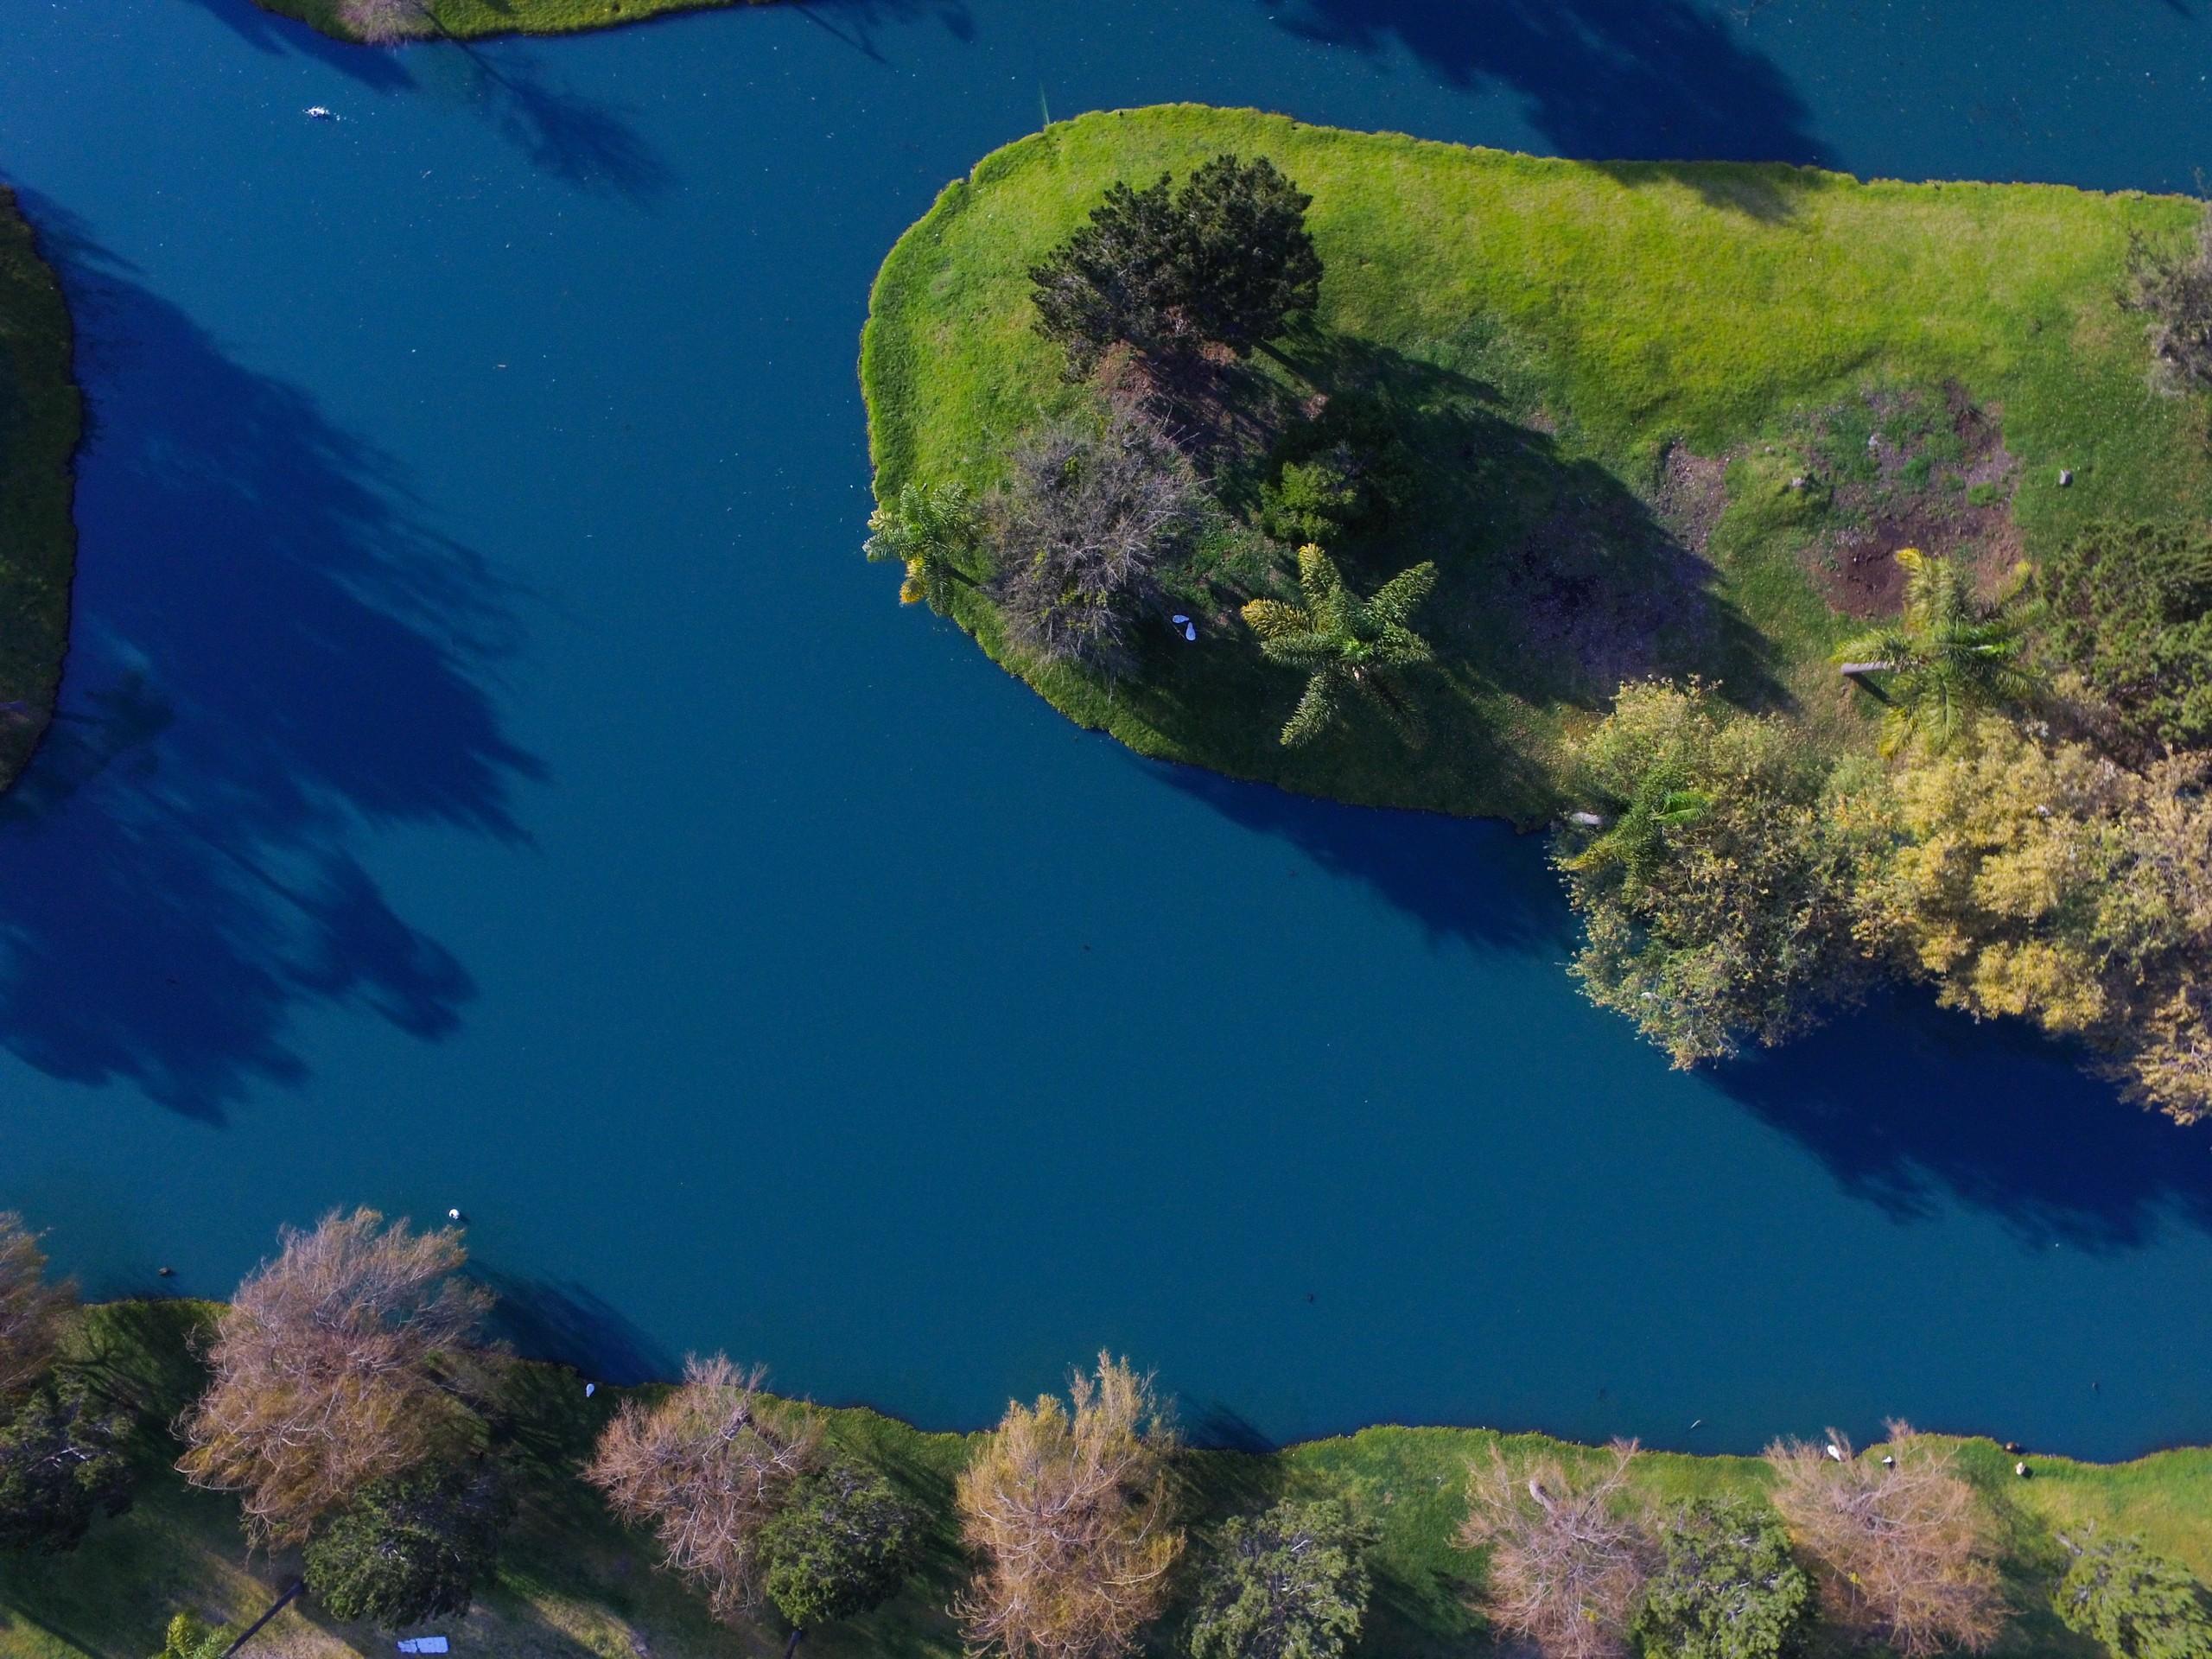
Calidad de Aguas Superficiales
Cribado de pigmento y turbidez en aguas interiores, con ajustes publicados aplicados sin cambios.
APPLIED SPECTROSCOPY SERIES
Read the method in full.
The unmixing equations, the error propagation, and the validation behind each layer, written out for your own review.
The Spectral Advantage in Agriculture
Mapeo de carbono orgánico del suelo e identificación de residuos de cultivo con espectroscopía orbital.
FREQUENTLY ASKED QUESTIONS
Questions we get asked about this sector.
RUN IT OVER YOUR GROUND
Run this over your Agricultura area.
Order processing over your area, or a dedicated capture where the archive has nothing usable. Ask Lisaris in plain language to take the area, run the pipeline and tell you when the layers are ready.