
A monthly built record of a factory site in Grünheide, from open imagery
A lender financing a build wants to see how far a site has moved between draw requests. Seventeen of eighteen months at a large factory site in Brandenburg read clear, with 44 per cent of the site read as built by June 2022.
- Site
- Grünheide, Brandenburg
- Window
- Feb 2021 to Jul 2022
- Months read
- 17 of 18
- Built, June 2022
- 44.2% of the site
- Source
- Copernicus Sentinel-2
- Product
- Construction progress
The problem
A construction lender or a builder's risk insurer wants to see progress between draw requests without sending someone to the site every month.
What we did
The share of the site reading as built surface, read from Sentinel-2 every month for eighteen months, with the number of clear looks printed beside each figure.
The result
Seventeen of eighteen months read, 44 per cent of the site read as built by June 2022, and a true-colour image for the first and the latest month.
Overview
The construction site at Grünheide, south-east of Berlin, went from cleared forest to a working factory between 2020 and 2022. It is a public site with a well documented timeline, which makes it a good test of whether a monthly record from open imagery follows a build the way a lender would want to follow it.
This is one of our own test cases. Axine Labs has no connection with the site's owner, and the record was read from public Copernicus imagery only.
The challenge
A lender financing a construction project releases money against progress. The contractor's report says how far the build has come; the lender's question is whether the ground agrees. An insurer carrying builder's risk asks the same question for a different reason.
Sending someone to every site every month is expensive, and on a remote or large site it is slow. What the lender wants is a dated monthly series that can be set beside the contractor's report, with an image to look at when a number moves.
What we did
The site was read from Copernicus Sentinel-2 every month for the 18 calendar months ending July 2022. For each month the record counts the share of the site reading as built surface, using the same rule every month so that the series can be compared from one month to the next.
The number of clear looks behind each month is printed beside its figure. Where cloud took a month out, the table says so rather than filling the gap.
What the record showed
| Months in the window | 18, February 2021 to July 2022 |
| Months with a clear look | 17 |
| Built share of the site, February 2021 | 39.6 per cent |
| Built share of the site, June 2022 | 44.2 per cent |
| Clear looks per month | 1 to 8 |
Seventeen of the eighteen months had a clear look. The last month, July 2022, did not, and the table says so.
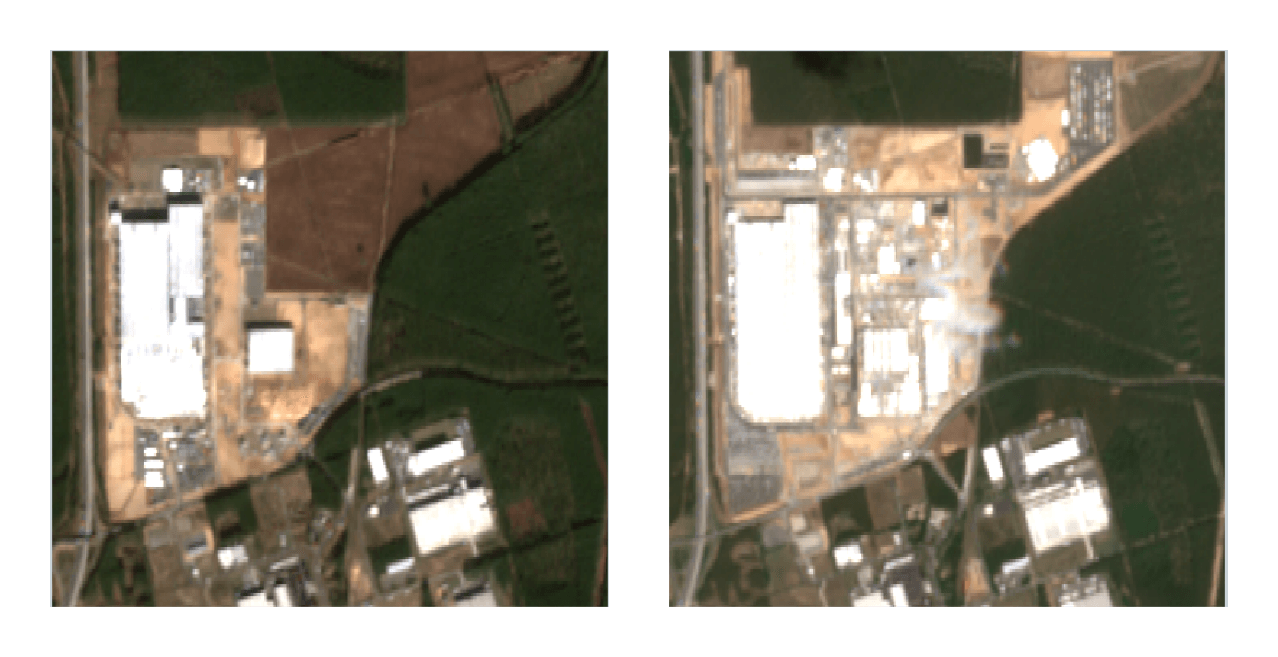
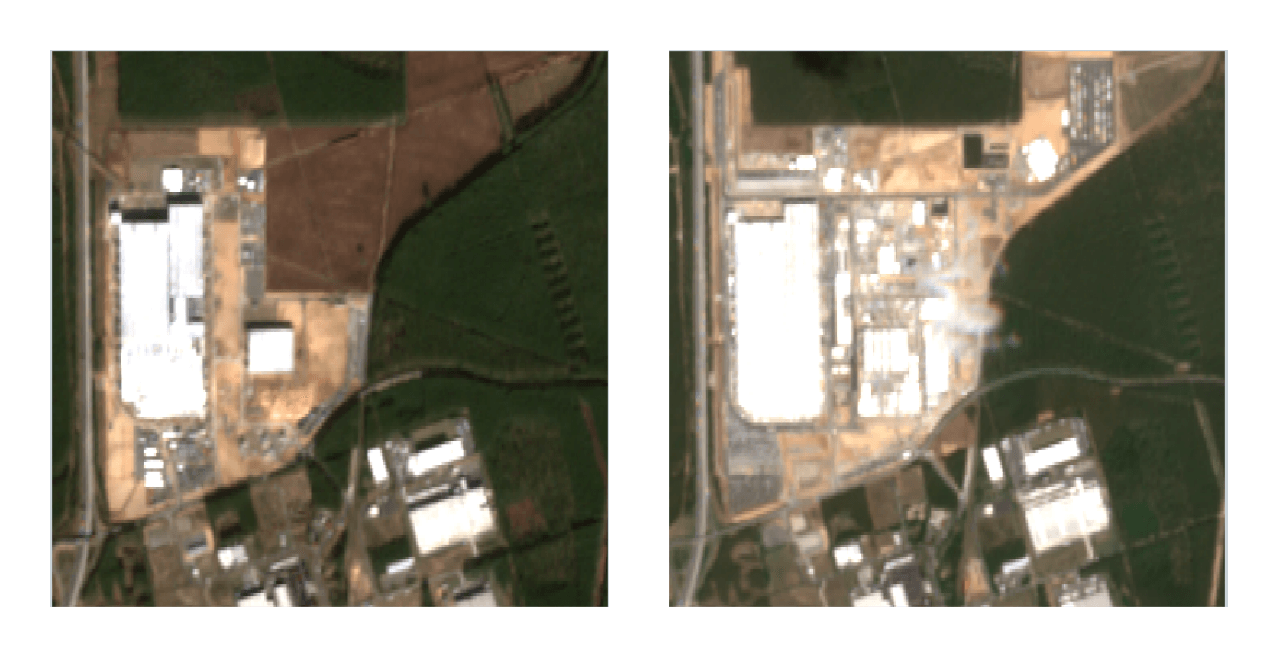
The two images show the change plainly. In February 2021 the main hall stands in cleared ground with ploughed land to the north. By June 2022 the buildings beside it are up and the open ground to the north has been paved.
The monthly series is not a straight line. Winter light and the number of clear looks move it from month to month, which is why the record prints the look count beside each value and why the images matter as much as the numbers.
What it means
For a lender the record is a dated monthly series from public imagery, with an image for the first and latest months, that can sit beside a contractor's progress report. When a drawdown request and the ground disagree, the lender knows before the money moves.
The series covers the most recent 18 months, which matches the life of a build and a lender's drawdown schedule. A planned footprint can be sent with the site boundary, and the record then reports the built share of the footprint as well as of the site.
Run this on your own ground
Draw an area of interest, pick the dates, and the same analysis runs against the archive over your sites.
References
- Axine Labs (2026). Dated records for claims and portfolios. Three live runs, section 2.
- European Space Agency. Copernicus Sentinel-2 mission. sentinels.copernicus.eu
More case studies
Storm Johannes: which stands to visit first, ranked from open imagery
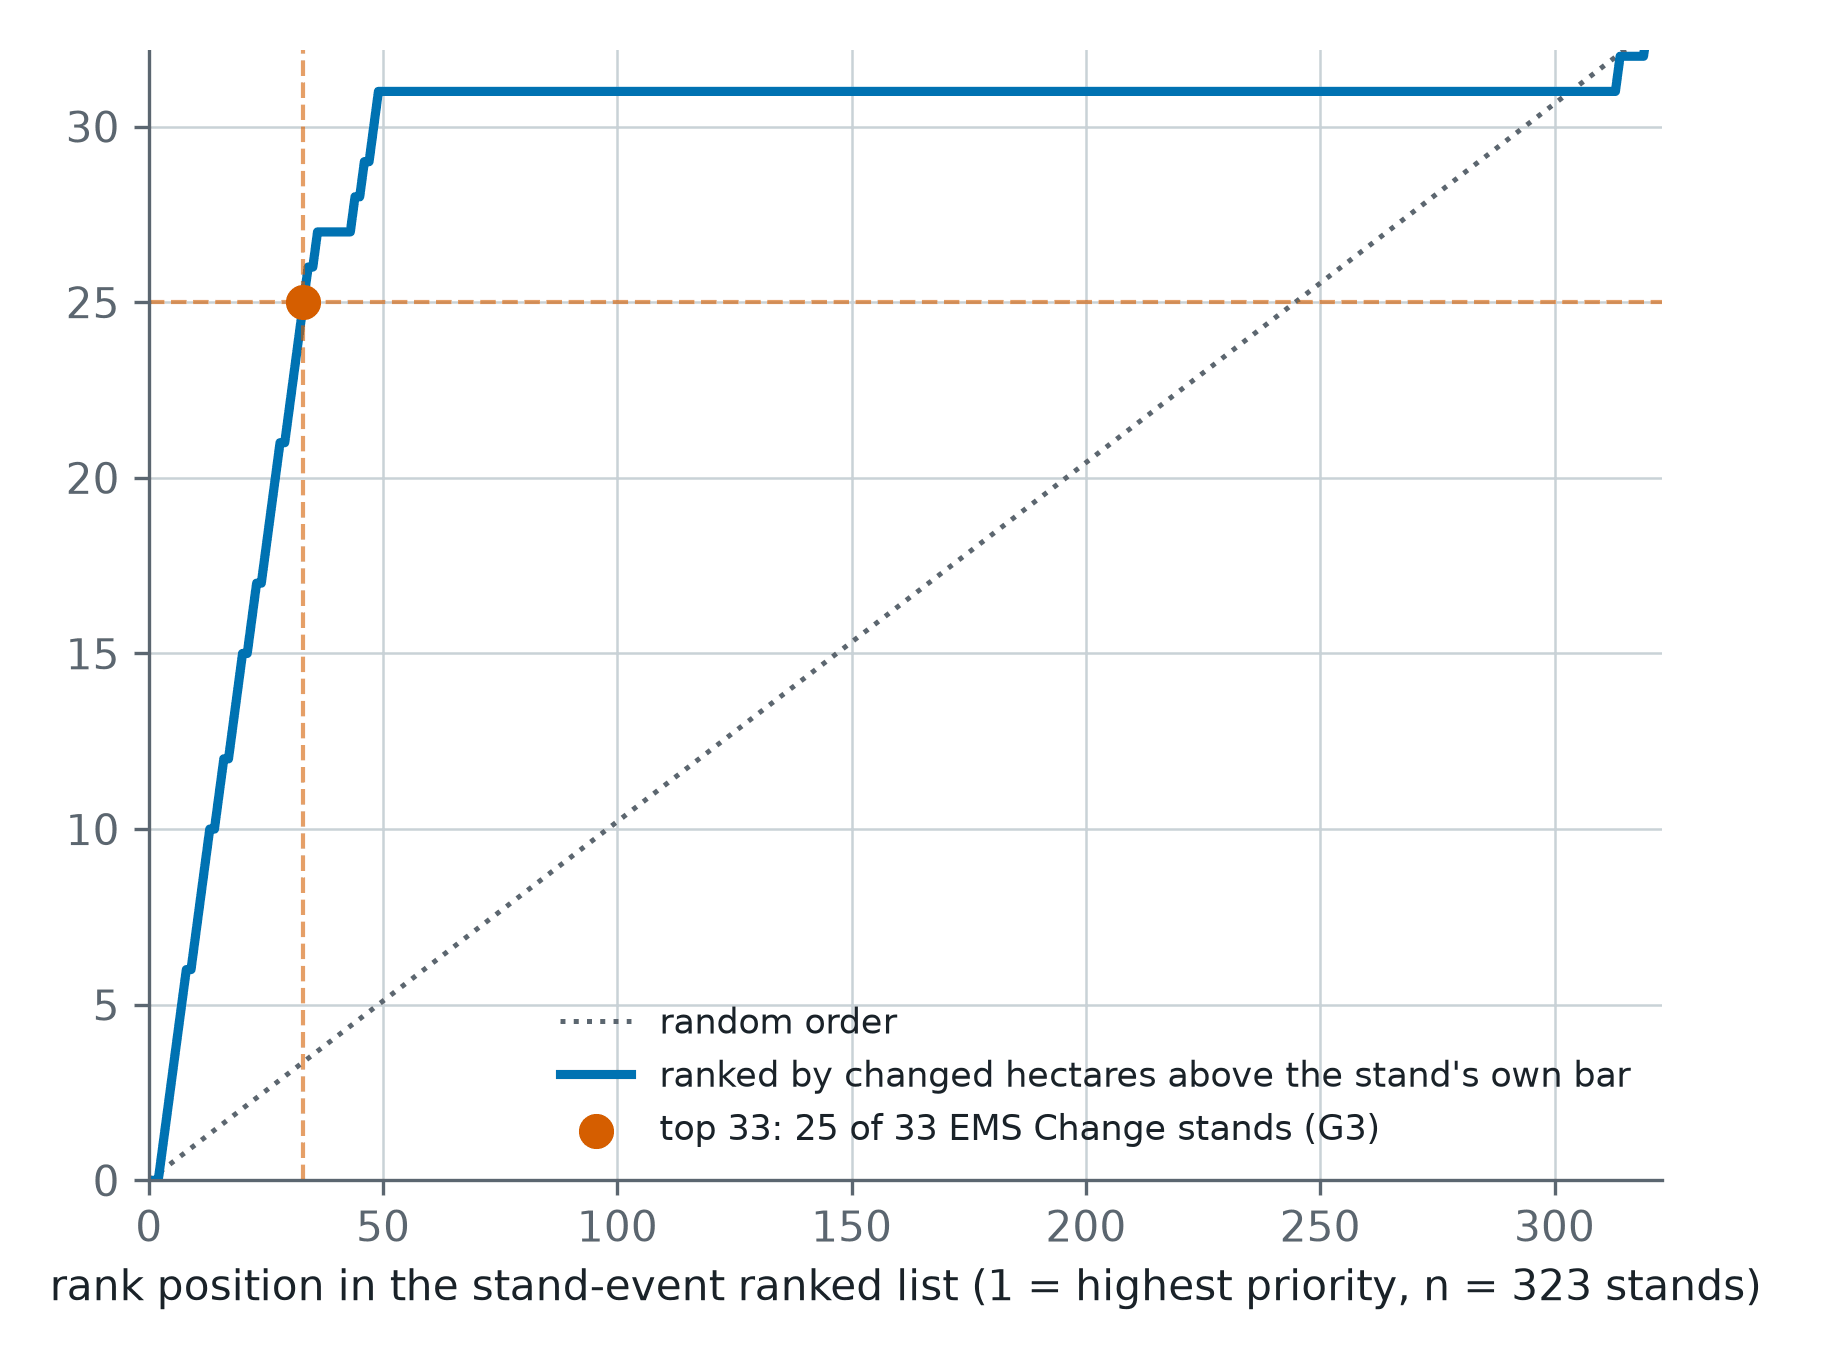
After the December 2025 storm in central Sweden, 323 test stands were ranked from Sentinel-1 and Sentinel-2. Of the 33 the storm had changed, 25 sat in the top 33 of the list. Random order would have put three or four there.
Forty-three seasons of one Nebraska pivot, and its first zone map
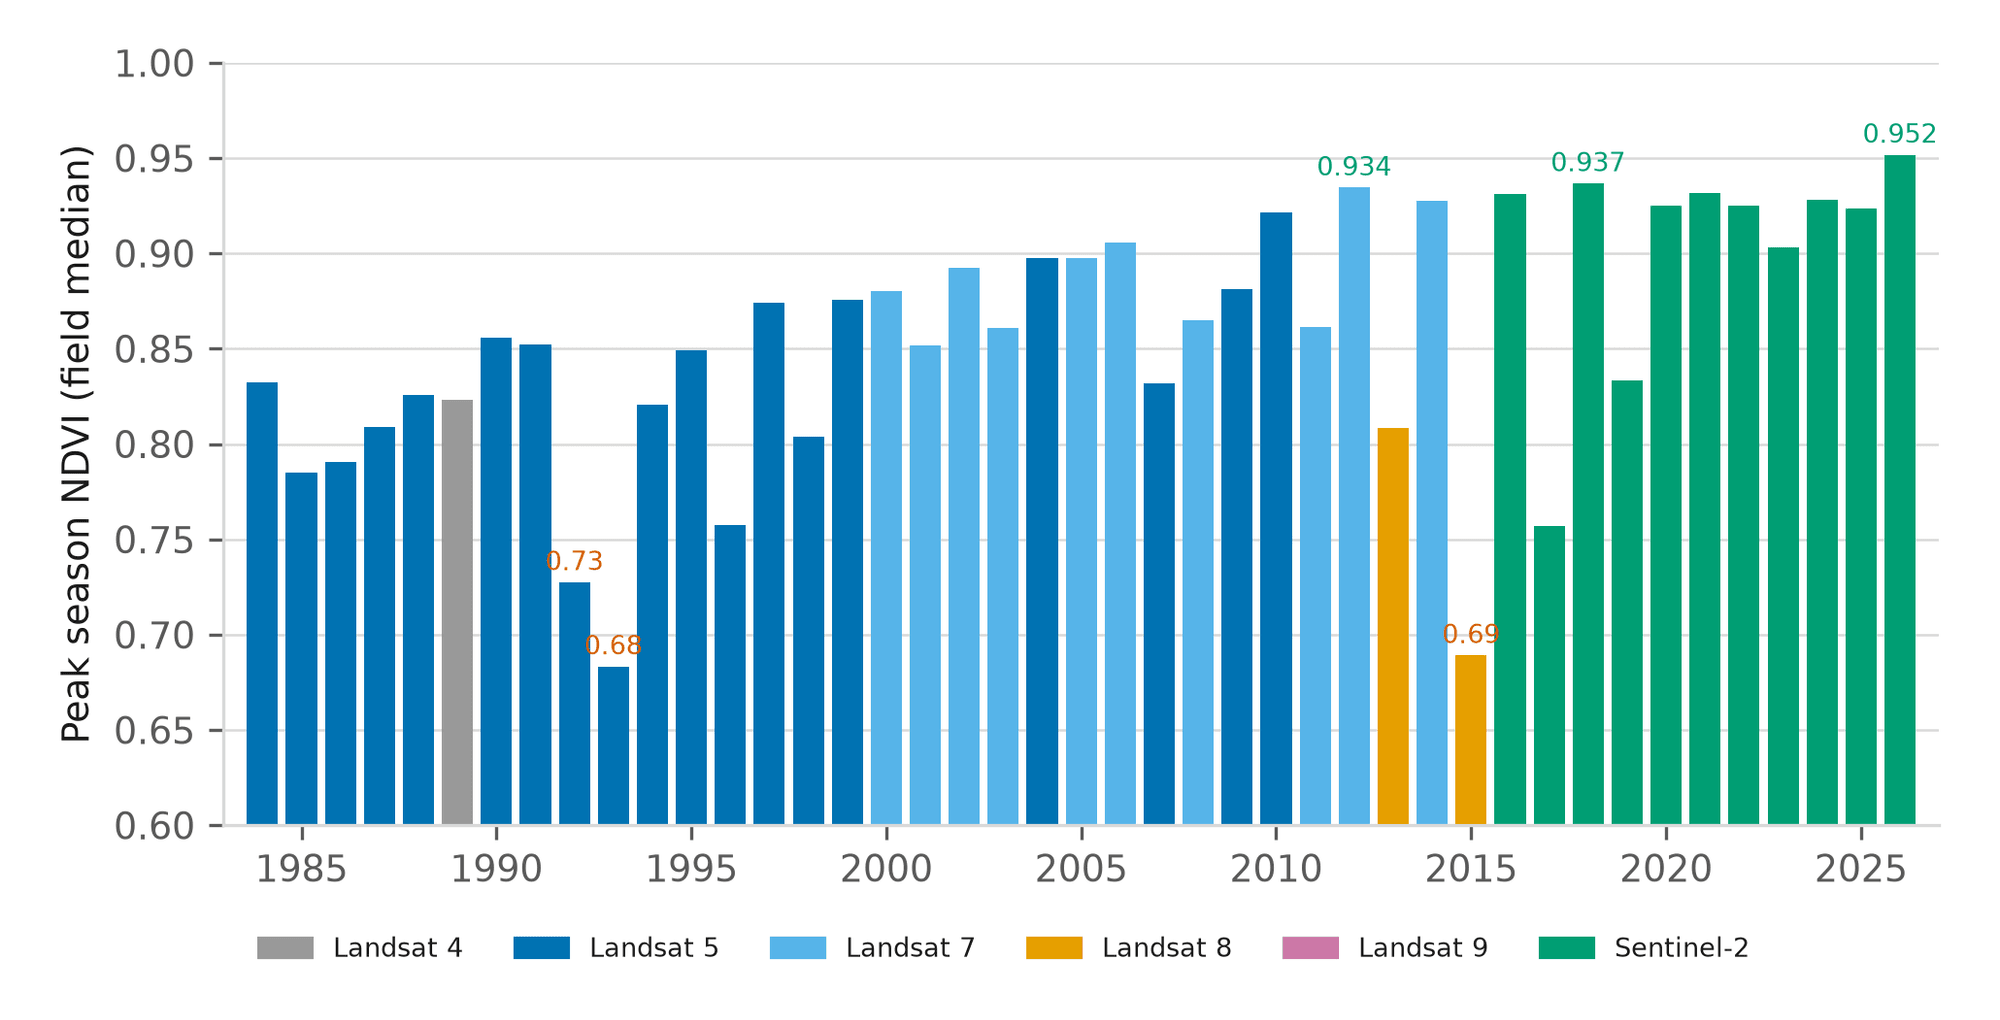
Before driving out, an agronomist wants to know whether this season is unusual for this field, not for the county. One centre pivot near Seward has a reading for every season from 1984 to 2026, and 2026 is the highest of them.
A Kansas season on one page, and the next two weeks of disease pressure
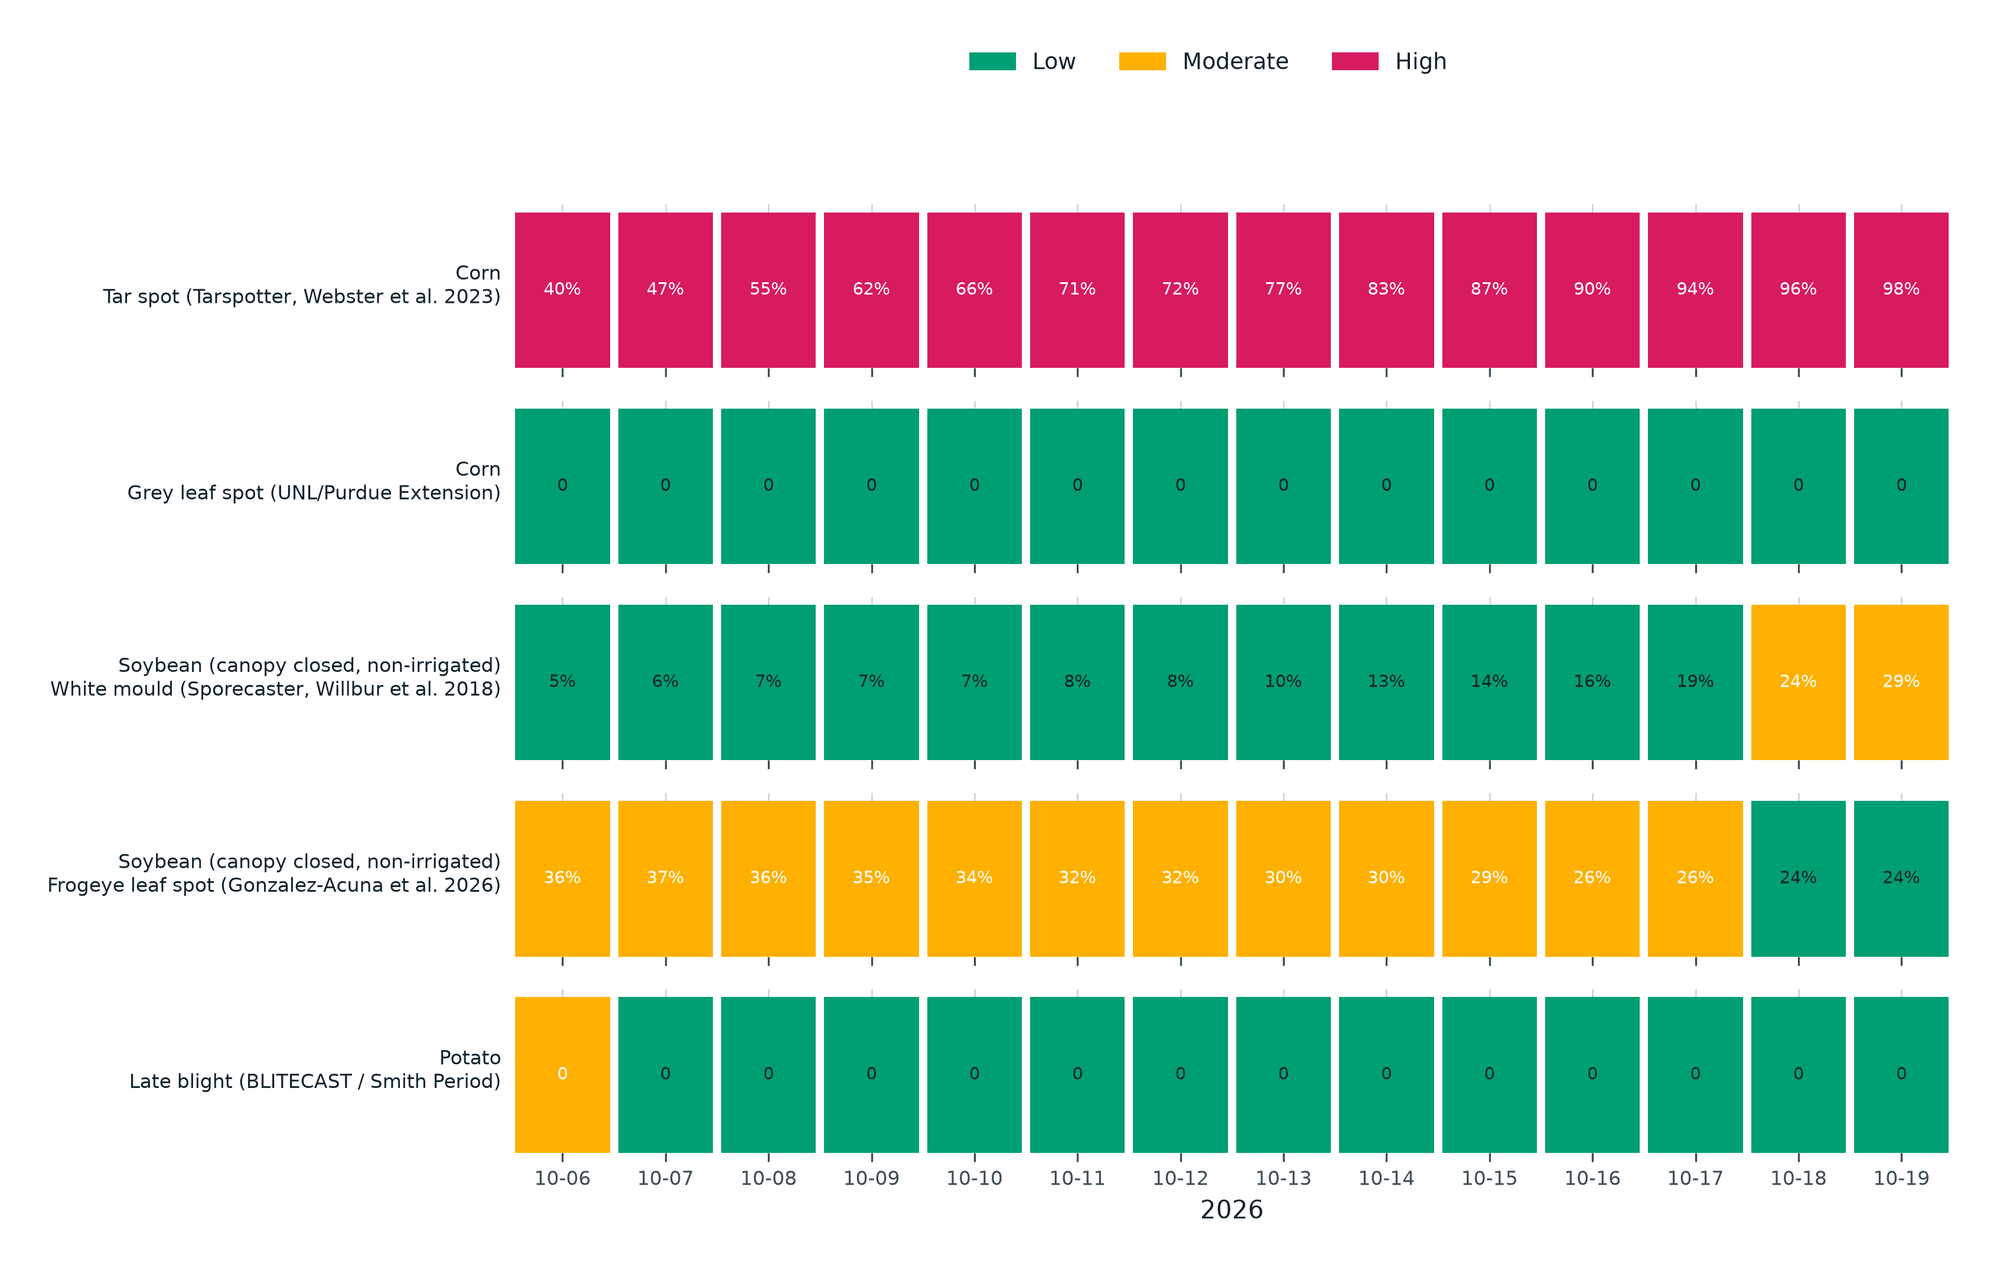
A 61-hectare corn pivot in western Kansas, 184 days into the 2026 season: 53 days at or above 35 °C against a normal of 27.8, more heat units than usual, and five published disease models run on the field's own forecast.