
Jagersfontein Tailings Flow Footprint Mapped Five Days After the Dam Failure
Footprint of the 2022 Jagersfontein tailings flow from five archive scenes: a 910 hectare connected flow at five days against a 19 hectare pre-failure control.
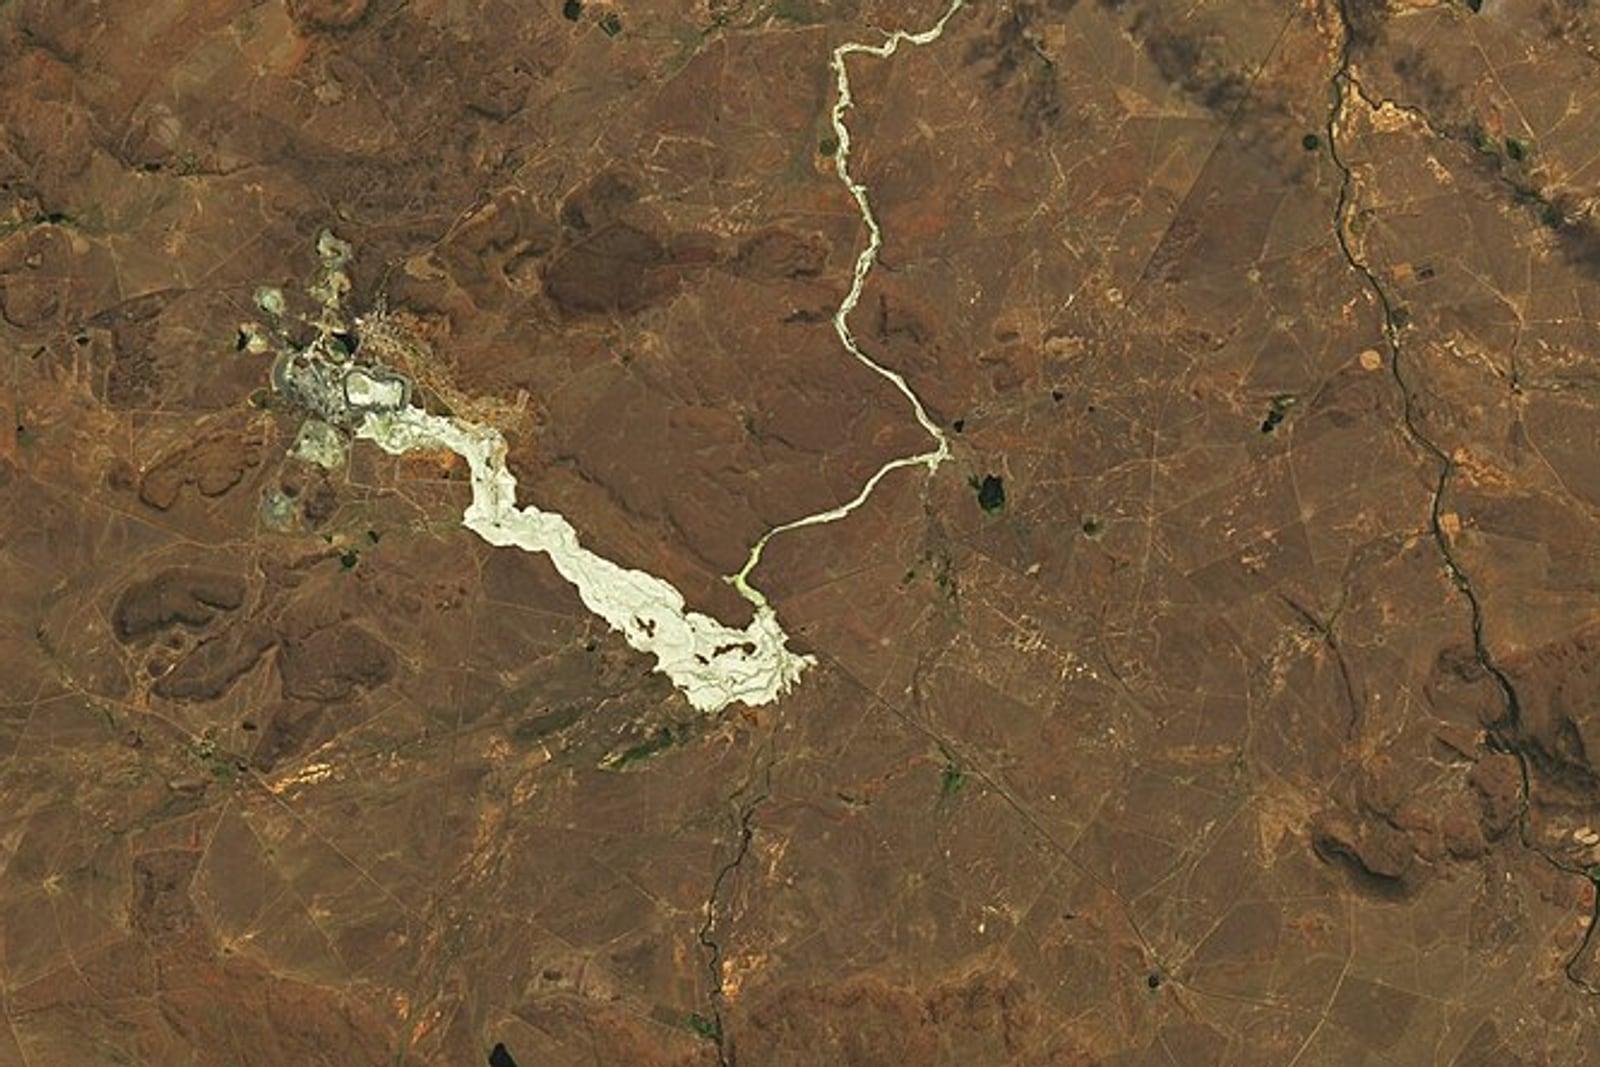

- Location
- Jagersfontein, Free State, South Africa
- Area
- About 24 by 19 kilometres, 512.7 km² observed
- Record
- Failure 11 September 2022, five scenes from 27 August to 5 November 2022
- Deliverables
- Buried-ground footprint per date, connected flow boundary, pre-failure control
The problem
One of the decade’s worst tailings failures had no published footprint, and the two area figures in the literature differ by a factor of 1.6 with no stated method.
What we did
Five archive scenes over the impoundment and the runout, scored on one fixed vegetation loss threshold, with two pre-failure dates as the control.
The result
910 hectares in one connected flow at five days against 19 hectares from the control, as a boundary a claims adjuster or a regulator can open and check.
The Objective
A tailings dam at the Jagersfontein diamond workings in the Free State failed early on 11 September 2022. Roughly five million cubic metres of saturated waste ran through the edge of the town and about seven kilometres across grazing land before reaching the stream network. A farmer’s compensation claim, a rehabilitation order and an insurer’s reserve all turn on a footprint that can be checked. The International Charter was triggered on 12 September and its two products are not public, and the published area estimates, more than 26 square kilometres and about 1,600 hectares, differ by more than half with neither stating a method or a boundary.
Scene Selection and Change Test
The platform analysed a box of about 24 by 19 kilometres holding the impoundment, the town and the full overland runout.
- Pre-failure scenes: 27 August and 6 September 2022.
- Post-failure scenes: 16 September, 6 October and 5 November 2022.
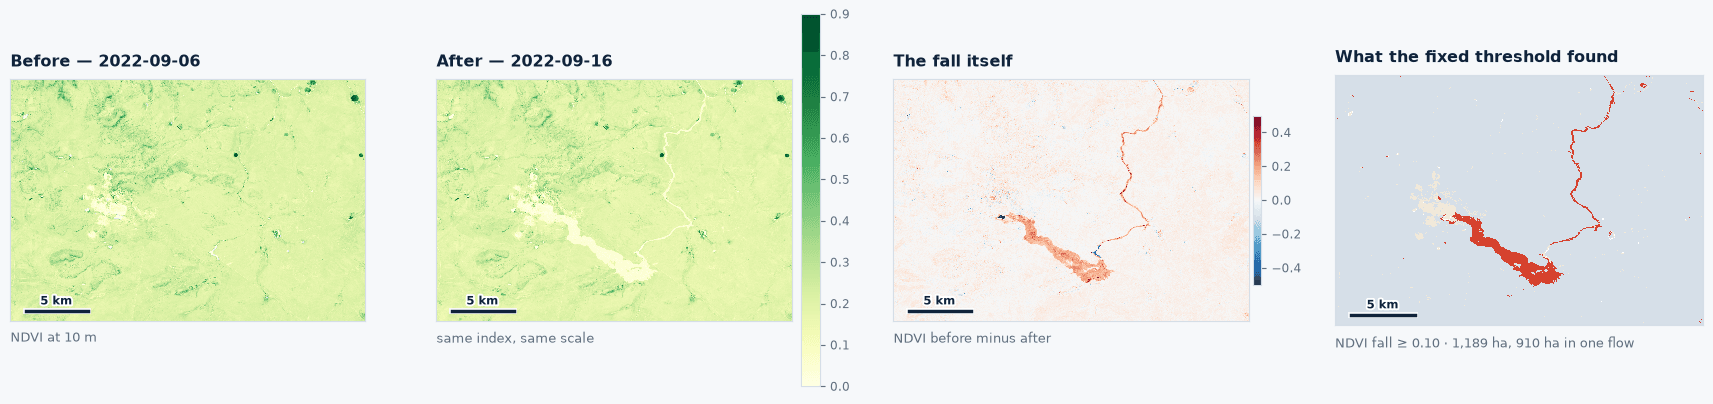
- Change test: one vegetation loss threshold between a pre-event and a post-event scene, fixed in advance and applied to every pair.
- Scoring mask: ground that carried vegetation beforehand, set before any post-event scene was read.
- Minimum patch: connected patches of half a hectare and larger.
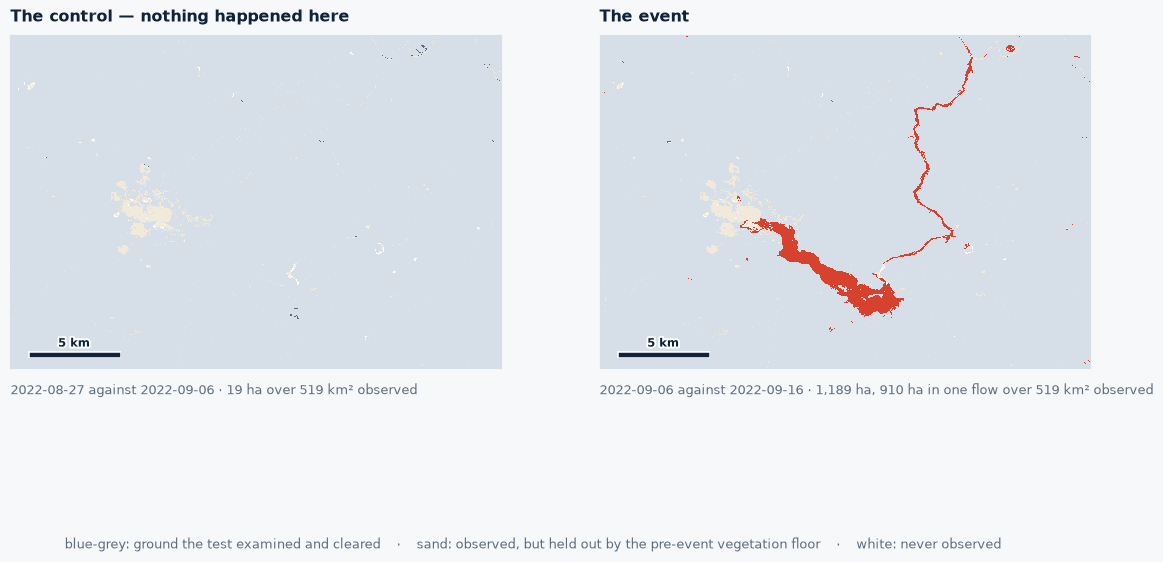
The threshold was never adjusted toward any published figure. On dry September Karoo the vegetation mask moves the five day figure by about one per cent. To establish the noise floor, the system runs the same test across the two pre-failure scenes, which bracket ten days in which the dam was still standing.
Footprint Findings
The pipeline returned one dominant connected flow on every post-failure date.
- Control, 27 August against 6 September: 19 hectares in 6 patches, largest patch 2.6 hectares.
- 16 September, 5 days after failure: 1,189 hectares in 34 patches, largest connected flow 910 hectares.
- 6 October, 25 days after failure: 1,135 hectares in 107 patches, largest 798 hectares, over 446.5 km² observed under partial cloud.
- 5 November, 55 days after failure: 750 hectares in 56 patches, largest 624 hectares.
At five days the event is sixty two times the control, and the 910 hectare component alone is 350 times the largest patch the control produced. That component runs about eight kilometres from the impoundment across the ground below the town, the same length and orientation as the plume measured two days after the failure by a different observer on a different sensor. Between 16 September and 5 November the measured footprint falls by 37 per cent as vegetation pushes back through the thin margins, while the core of the deposit stays in place.
Comparison With Published Figures
- This study, 5 days after failure: 1,189 hectares buried, 910 hectares in one flow, fixed threshold with a control, boundary published.
- Torres-Cruz and O’Donovan 2023: plume 8.5 by 1.5 kilometres, 4 to 6 million cubic metres, from commercial imagery and stereo elevation.
- Comparison circulated October 2022: more than 26 square kilometres of grazing land damaged.
- Marais et al. 2024: about 1,600 hectares of agricultural and grazing land.
The record measures living ground that was buried, about 12 square kilometres of it. The broader published estimates describe damaged land in a wider sense, including runout across Karoo ground that was bare before the tailings arrived.
Operational Utility
The 16 September scene was in the archive five days after the failure and a day before the first Charter product was delivered, with no tasking and no site visit. Liability is assessed against the earliest clean scene, since a map made two months later understates what was buried. Adjusters and regulators load the boundary into a GIS and read it against the 19 hectare control floor for this terrain. For a site with a live impoundment, the same test run on a schedule becomes a monitoring programme, with high-resolution imagery via our partner SkyFi where detail matters.
Run this on your own ground
Draw an area of interest, pick the dates, and the same analysis runs against the archive over your sites.
References
- Torres-Cruz L.A. and O'Donovan C. (2023). Public remotely sensed data raise concerns about history of Jagersfontein dam. Scientific Reports 13, 5556. doi.org/10.1038/s41598-023-31633-5
- Marais L. et al. (2024). The Jagersfontein tailings dam failure. International Journal of Disaster Risk Reduction 109, 104585. doi.org/10.1016/j.ijdrr.2024.104585
- International Charter Space and Major Disasters, activation requested by the National Disaster Management Centre, 12 September 2022.
- WISE Uranium Project, chronology of major tailings dam failures. wise-uranium.org/mdaf.html
More case studies
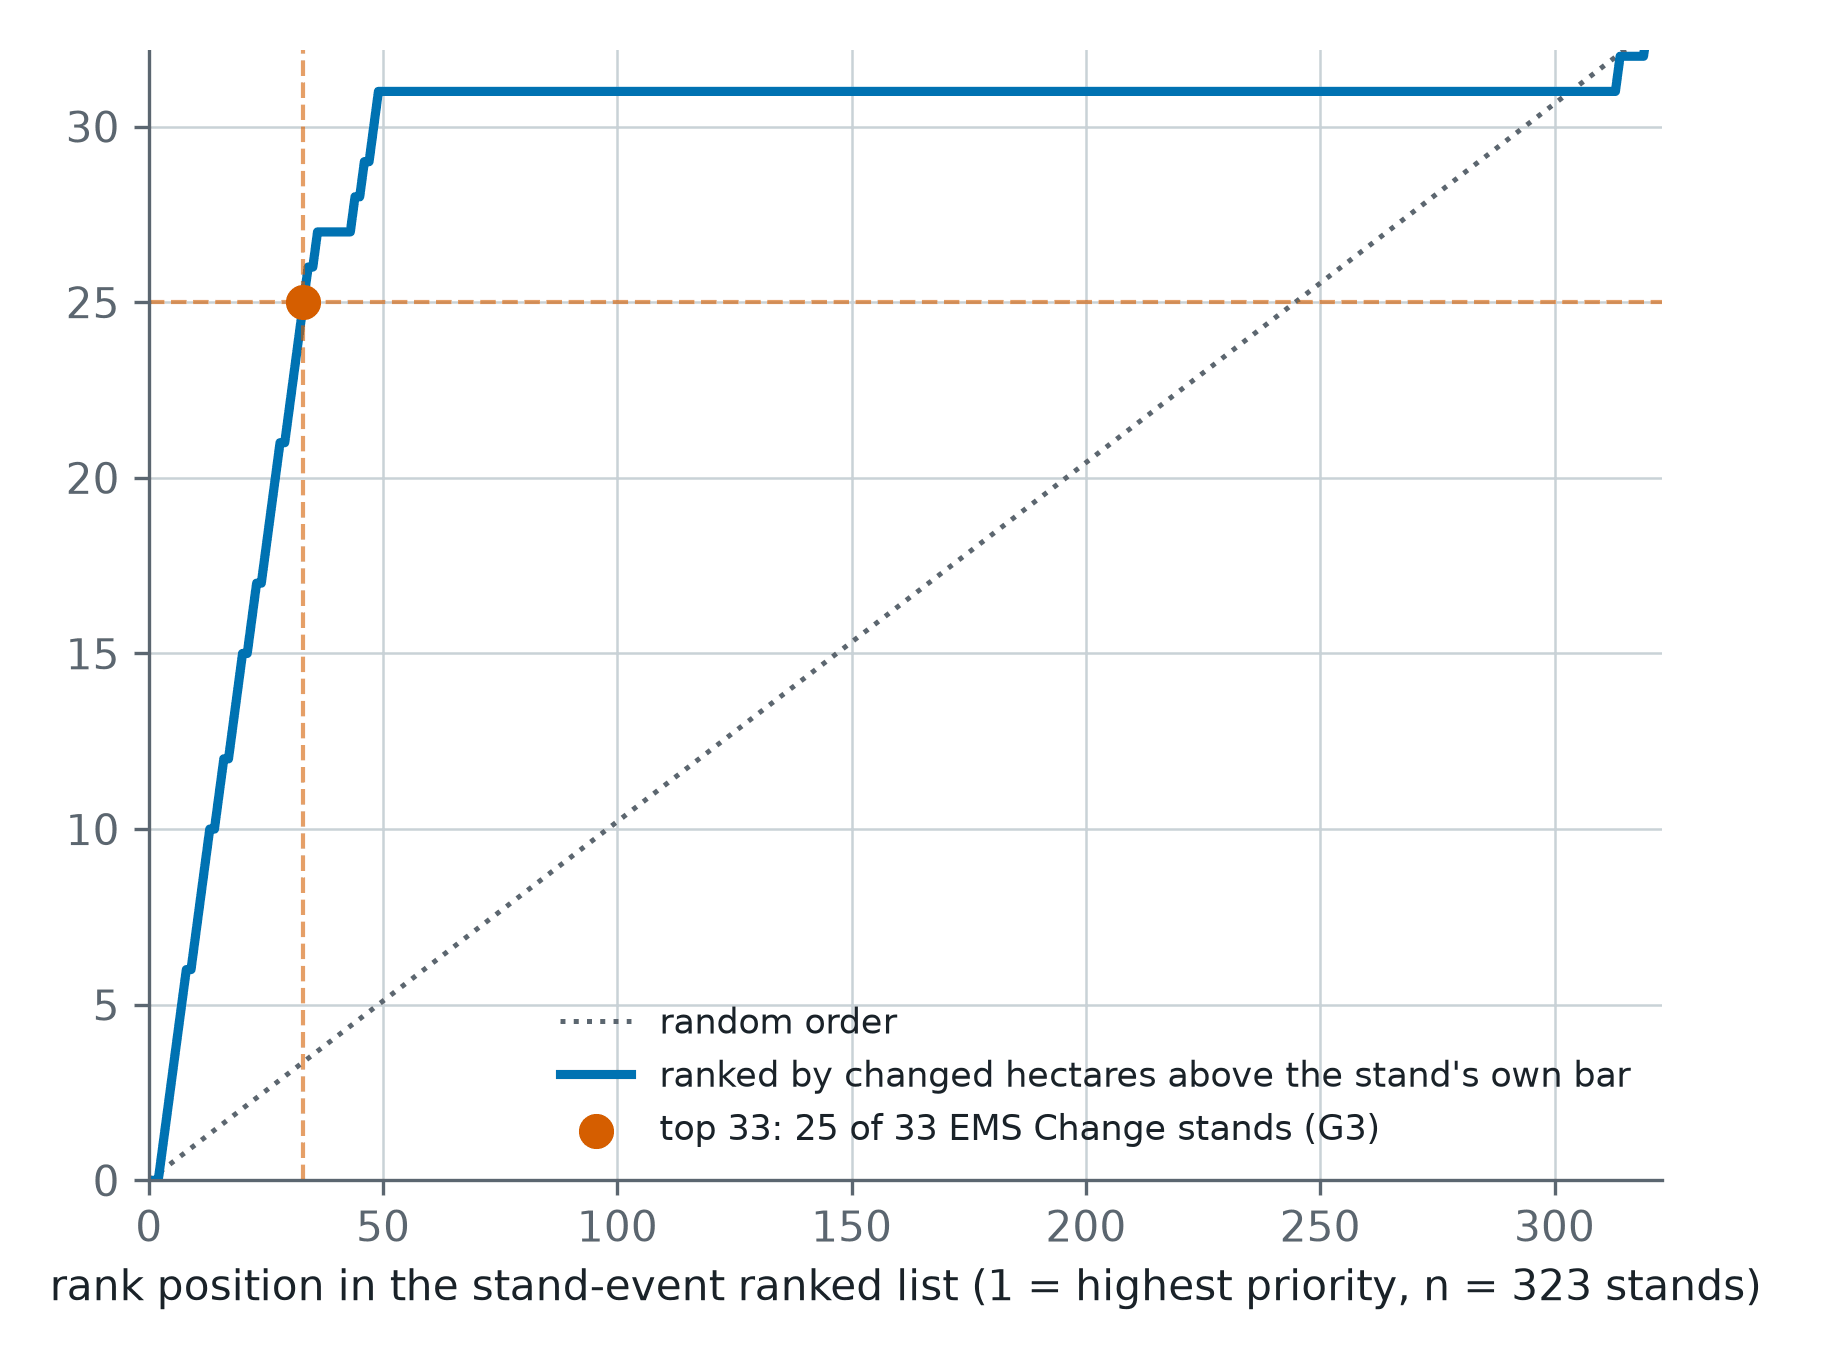
Storm Johannes Stand Ranking From Sentinel-1 and Sentinel-2 Across 323 Swedish Conifer Stands
A post-storm ranking of 323 one-hectare conifer stands in central Sweden, each read from Sentinel-1 and Sentinel-2 against its own quiet years and scored against Copernicus EMS grading.
Forty-Three Seasons of a Nebraska Pivot and Management Zone Delineation
A 43-year canopy baseline for one centre pivot near Seward, Nebraska, and a three-tier management zone map built from vegetation, terrain and radar moisture.
Season Brief and Fourteen-Day Disease Forecast for a Kansas Corn Pivot
A 184-day season brief for a 61-hectare corn pivot in western Kansas against its own 10-year normal, with five published disease models run on the field's own 14-day forecast.