
Satellites photograph every part of the Earth, every day. Almost none of that imagery ever becomes a decision. It sits in archives, measured in petabytes, waiting for someone with the tooling, the training and the patience to turn it into an answer. For most teams that someone is a consultant, a service bureau, or a colleague with a GIS licence and a backlog. The imagery exists. The answers do not.
Lisaris EO Studio exists to remove that bottleneck. It is the working end of Axine Labs: a browser studio where you draw an area of interest, choose from more than sixty analytics, and receive finished layers in a workspace built for reading them. No desktop software chain, no processing scripts, no waiting for someone else's queue. This is the full tour.
The studio, end to end
Every job in Lisaris follows the same path, and each step earns its place.
Draw the area. Any square on Earth. A licence block in the Andes, a pipeline corridor across a basin, a reservoir a city drinks from, a timber concession the auditors are asking about. Paste coordinates or draw it by hand. The platform treats the area you draw as the unit of work: everything that follows is scoped to it.
Find the scenes. Lisaris searches the archive over your area and shows what exists: when each scene was captured, what it covers, and whether it is worth analysing. Cloud, haze and coverage are visible before you spend anything. Every analytic reports its source the same way: free or commercial imagery, matched to the job, with commercial sub-metre capture being integrated into the same workflow.
Run the analysis. Pick the layers the question needs. Alteration mineralogy over a porphyry target. A methane screen along gas infrastructure. Canopy stress across a drought-hit forest. Surface water quality on a bloom-prone lake. Each analytic runs where the scene sits, fits against public reference standards, and carries one design rule through every product: where the data cannot support an answer, the platform refuses to give one. Vegetation, cloud shadow, low signal and invalid pixels are masked and reported as masked, never averaged into a number that looks better than it is.
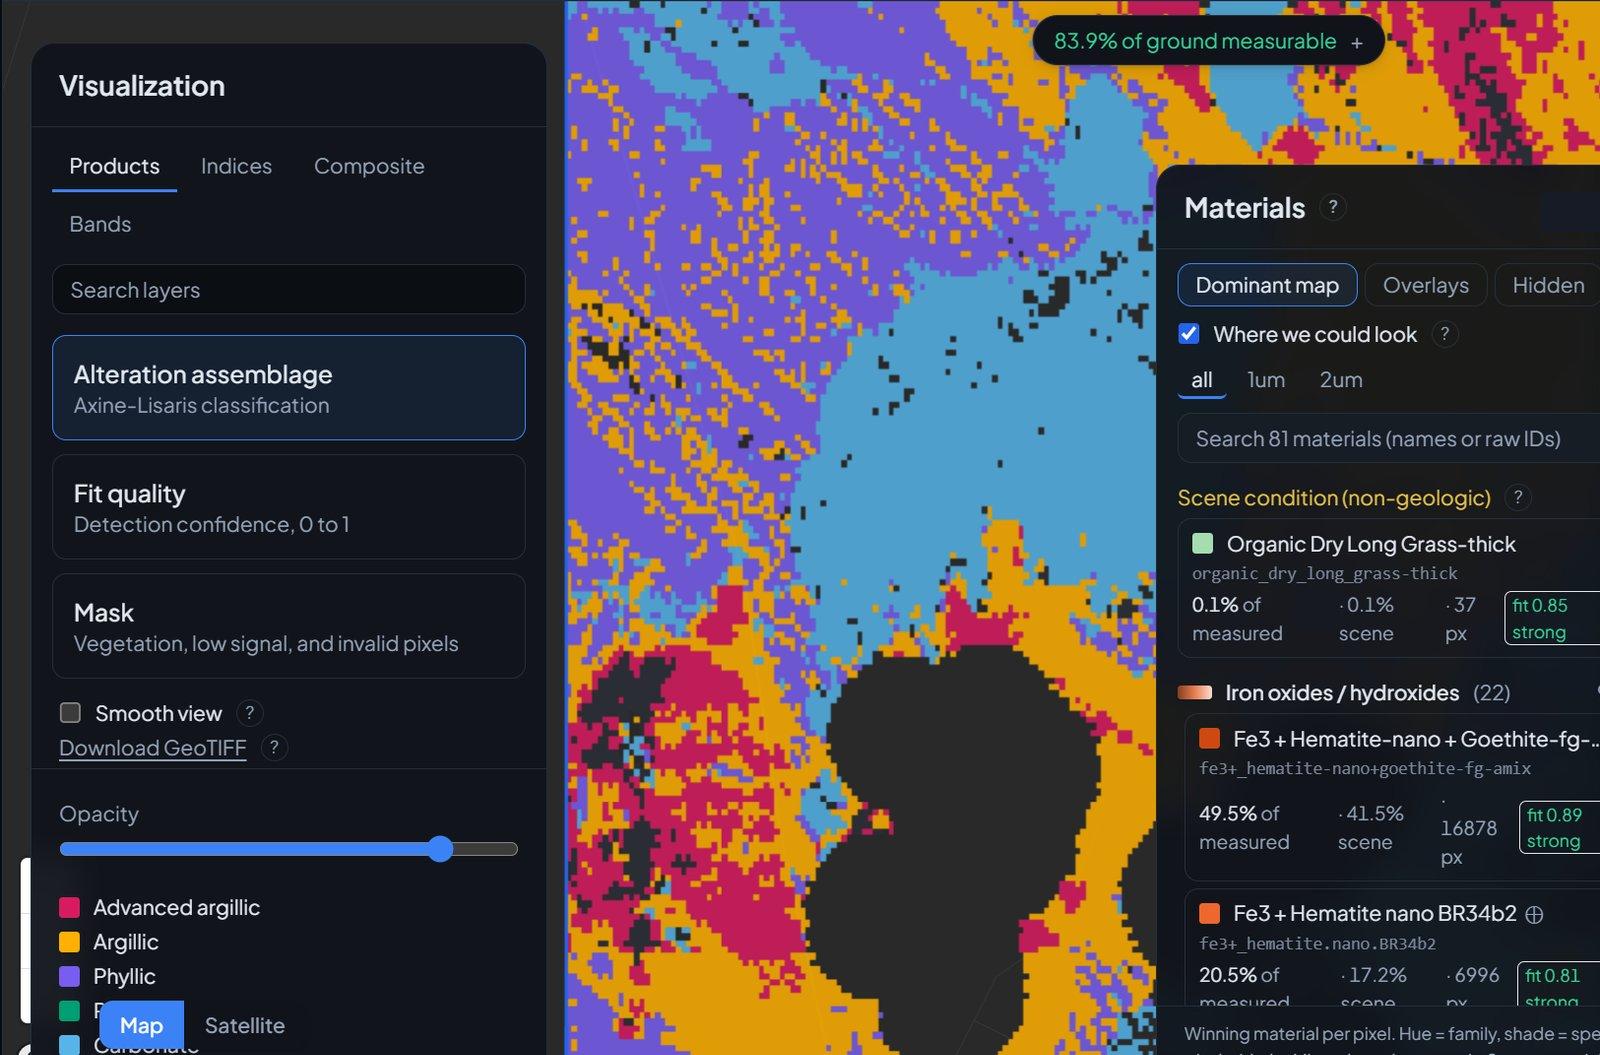
Read the result. This is where Lisaris stops being a processing service and becomes a studio. The workspace opens on your layer over a real basemap, with a map and satellite view, an opacity slider that actually works, and per-pixel inspection: point at any pixel and read the value the analysis produced there. A legend explains every class. A statistics panel reports what the layer measured across the scene, and a coverage panel tells you plainly how much ground was measurable and why the rest was masked.
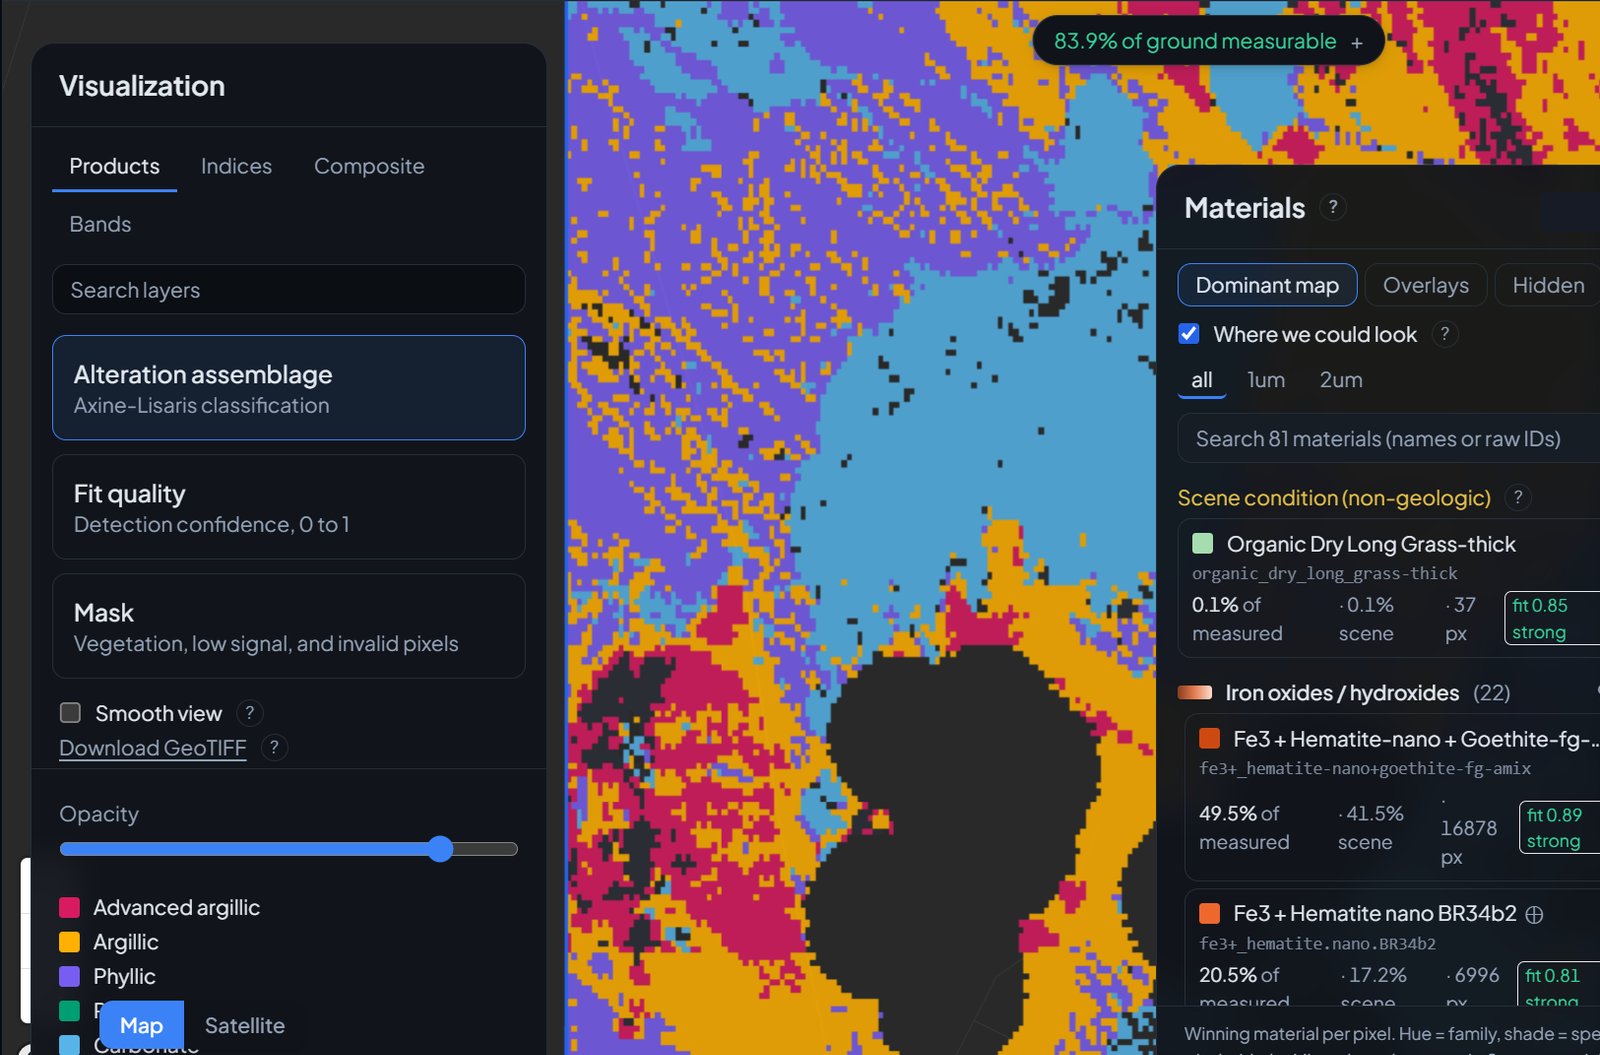
Keep what you need. Every layer exports as a GeoTIFF for your GIS and vector outlines as GeoJSON where the product calls for them. Statistics export as CSV. Provenance rides along with every download: which scene, which analysis version, when it was processed. Six months from now, when someone asks where a map came from, the answer is attached to the map.
What the catalogue covers
The catalogue runs past sixty analytics across mineralogy and alteration, emissions and plumes, water quality, forestry and canopy, agriculture and soil, infrastructure and geohazards, and anomaly detection. These are not sixty variations of one index. They range from exact band arithmetic that has been published for decades, applied unchanged, to library-fitting mineral classification checked against an independent expert system. Every solution page on this site states what the layer detects, how the method works, what conditions it needs, and what it will not claim.
What follows is how that catalogue lands in each industry.
Mineral exploration
Exploration is where Lisaris started, and it shows. The mineral lane is built around a question every geologist recognises: where should the next dollar of fieldwork go?
Alteration mineral mapping classifies the advanced argillic, phyllic and propylitic assemblages that zone around hydrothermal systems, resolved per pixel and fitted against public laboratory reference spectra. Alteration cluster detection pulls the spatially coherent hubs out of that map, the places where alteration organises rather than scatters. Porphyry vectoring tracks how white mica composition shifts from the centre of a system to its fringe, a gradient that used to demand a dense sampling programme. Gossan analysis separates hematite from goethite and reports the iron-hydroxyl reading alongside, which is the difference between a leached cap worth walking and ordinary iron staining. District prospectivity scoring rolls the evidence up to a ranked surface you can plan a season against.
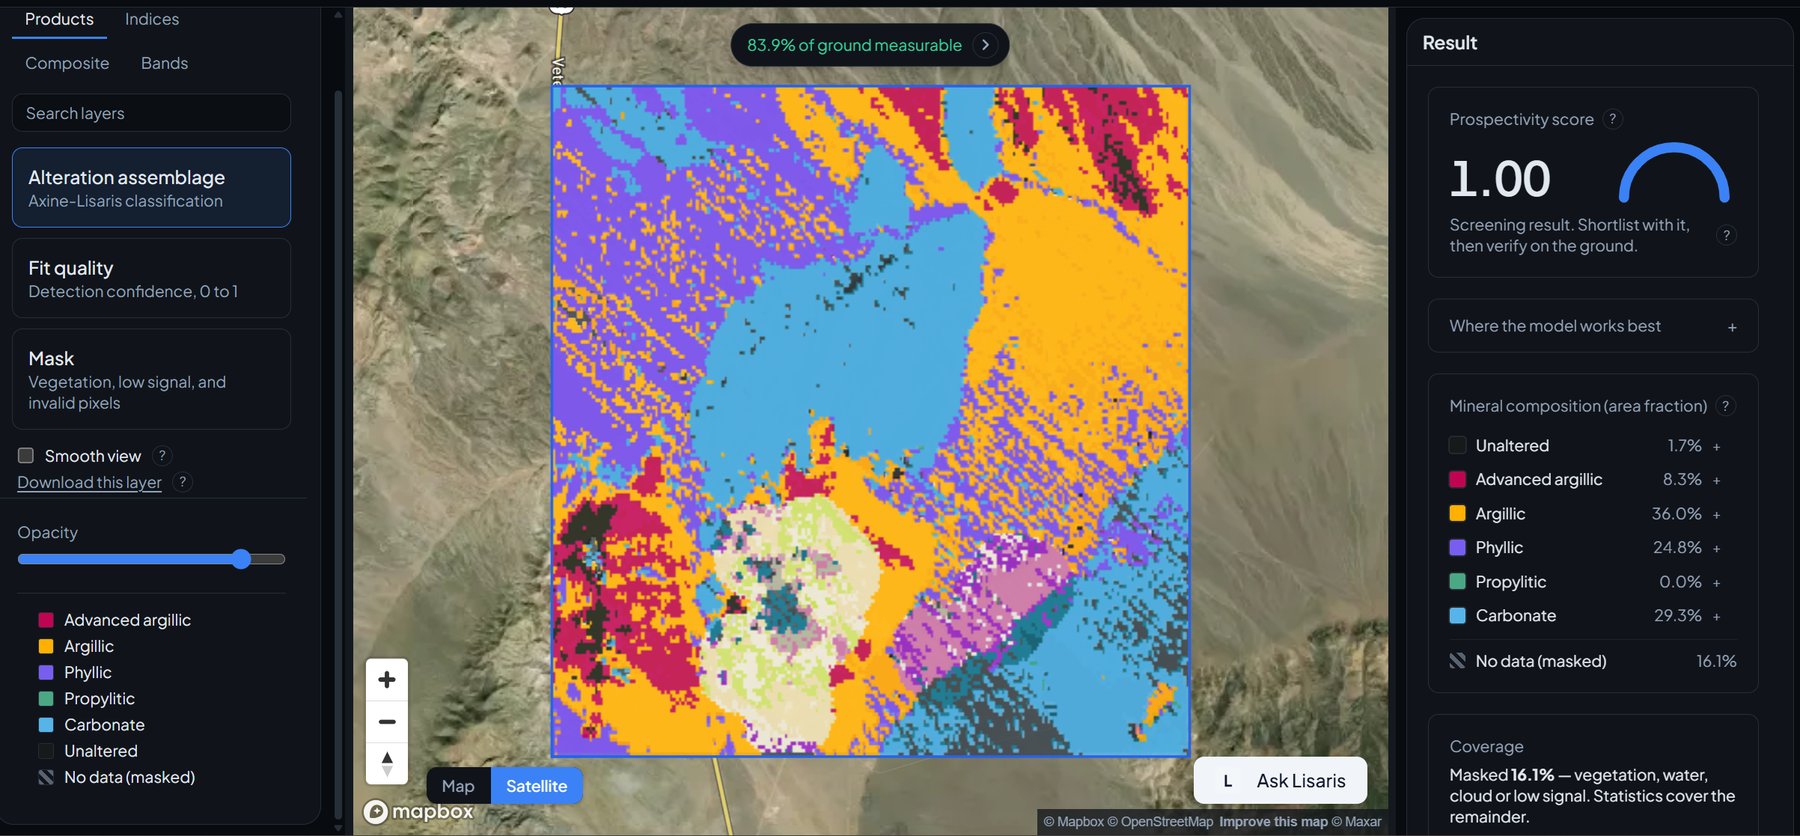
The honest boundary, stated everywhere it matters: these layers read surface mineralogy and its arrangement. They rank where to look first. Ore grade is a question for the drill, and the platform says so rather than pretending otherwise.
Energy
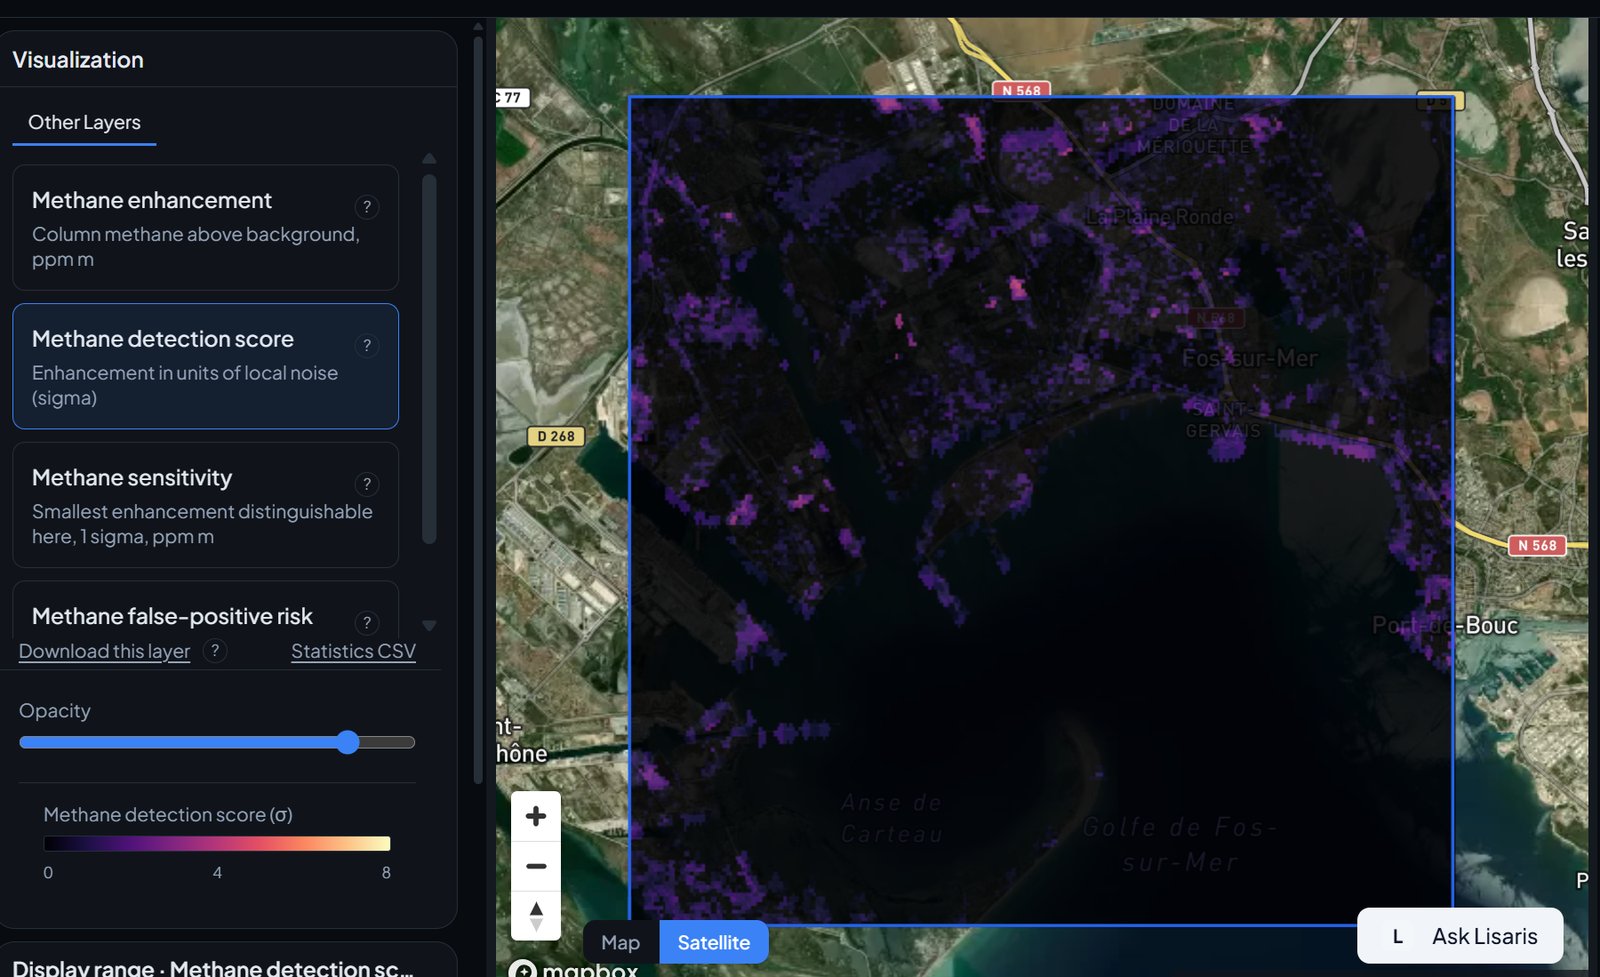
Methane is the fastest-moving problem in the sector, and the layer treats it with matching seriousness. The detection score reports enhancement in units of local noise, so a plume has to beat the ground beneath it to appear at all. A sensitivity layer states the smallest enhancement that was detectable over each pixel, and a false-positive risk layer flags the surfaces that imitate methane. Weak detections are refused rather than reported, because a screening tool that cries wolf gets turned off.
Beyond methane, geothermal teams read the surface expression of hidden systems, mapping the ammonium-bearing clays, steam-heated alunite and silica sinter that cap them. Microseepage screening looks for the slow surface chemistry that long-term hydrocarbon leakage leaves behind. Pipeline corridor monitoring watches clay-rich ground for the hydration changes that precede movement.
Water
Water managers get two very different problems solved with the same discipline. The first is biological: cyanobacterial blooms, where the pigment reading separates toxic cyanobacteria from harmless green algae early enough to matter, and where cell density is honestly not retrieved rather than dishonestly estimated. The second is chemical: acid drainage screening along mine discharge channels, where iron chemistry is gated on a ferric floor and reported as a class, and thermal contrast mapping at outfalls, reported against ambient rather than as a pretend absolute temperature.
In both cases the deliverable is a mapped outline with coordinates and statistics, not a PDF that arrives after the window to act has closed.
Forestry
Forests fail slowly and then suddenly, and the canopy layers are built for the slow part. Canopy stress screening follows the water content of foliage, which moves before colour does, and reports stand-relative change so a dry ridge is compared with its own history instead of a wetter valley. Selective logging audit resolves the slash, skid trails and landings that a harvest leaves, per pixel, against concession boundaries. Burn severity mapping differences pre-fire and post-fire scenes and separates burned ground from shadowed unburned trees, which broadband indices confuse on steep terrain.
Agriculture
The agricultural layers read the ground between the plants, which is exactly the part a windshield survey cannot see. Crop residue mapping sorts fields by the cellulose signature of dry stubble, the measurement behind tillage compliance. Topsoil clay and salinity screening reads mineralogy on bare, dry soil, flagging the ground that limits yield before the yield map proves it. Soil exposure mapping tracks bare-soil windows across a season, which is when every other soil measurement is possible at all.
Or simply ask
Everything above can be driven from panels and buttons. It can also be driven by a sentence. Lisaris is an agent as well as a studio: give it coordinates, an area, and the analytics you want, in plain language, and it creates the AOI, describes the ground it found there, searches the scenes, queues the work in the right order and notifies you when the layers land.
Ask it for a 100 km² square in the Chilean Andes with alteration mapping and prospectivity scoring, and it will come back describing the Cordillera de Domeyko, the exposure conditions, the scene count it found, and the order it is running your analyses in. The studio is the floor. The agent is the assistant walking it for you.
What we refuse to claim
Every analytic in the catalogue carries its scope with it. Detection layers publish their sensitivity instead of implying infinite sensitivity. Classifications mask what they cannot measure and report the masked fraction. Screening scores say they are screening scores. The validation protocol behind this posture, with worked results from live scenes, is public on the validation page, and the papers behind each method family are in the knowledge hub.
This is not modesty for its own sake. A tool that overclaims gets used once. A tool that states its boundaries gets built into workflows, because the people using it can defend what it told them.
Where it goes from here
The catalogue keeps growing, the archive keeps deepening, and commercial sub-metre capture is being integrated into the same draw-search-run workflow. Case studies from live ground are landing on this blog as they clear review.
Lisaris is live today at lisaris.axinelabs.com. Draw a square over ground you know, run a layer, and see whether it tells you something you did not already know. That is the whole pitch.