
ANALYTICS CATALOGUE
Every layer, and what it actually measures.
100 analytics run in the platform, across minerals, methane, water, vegetation and soil. These are the featured ones, and every layer exports straight into your GIS.
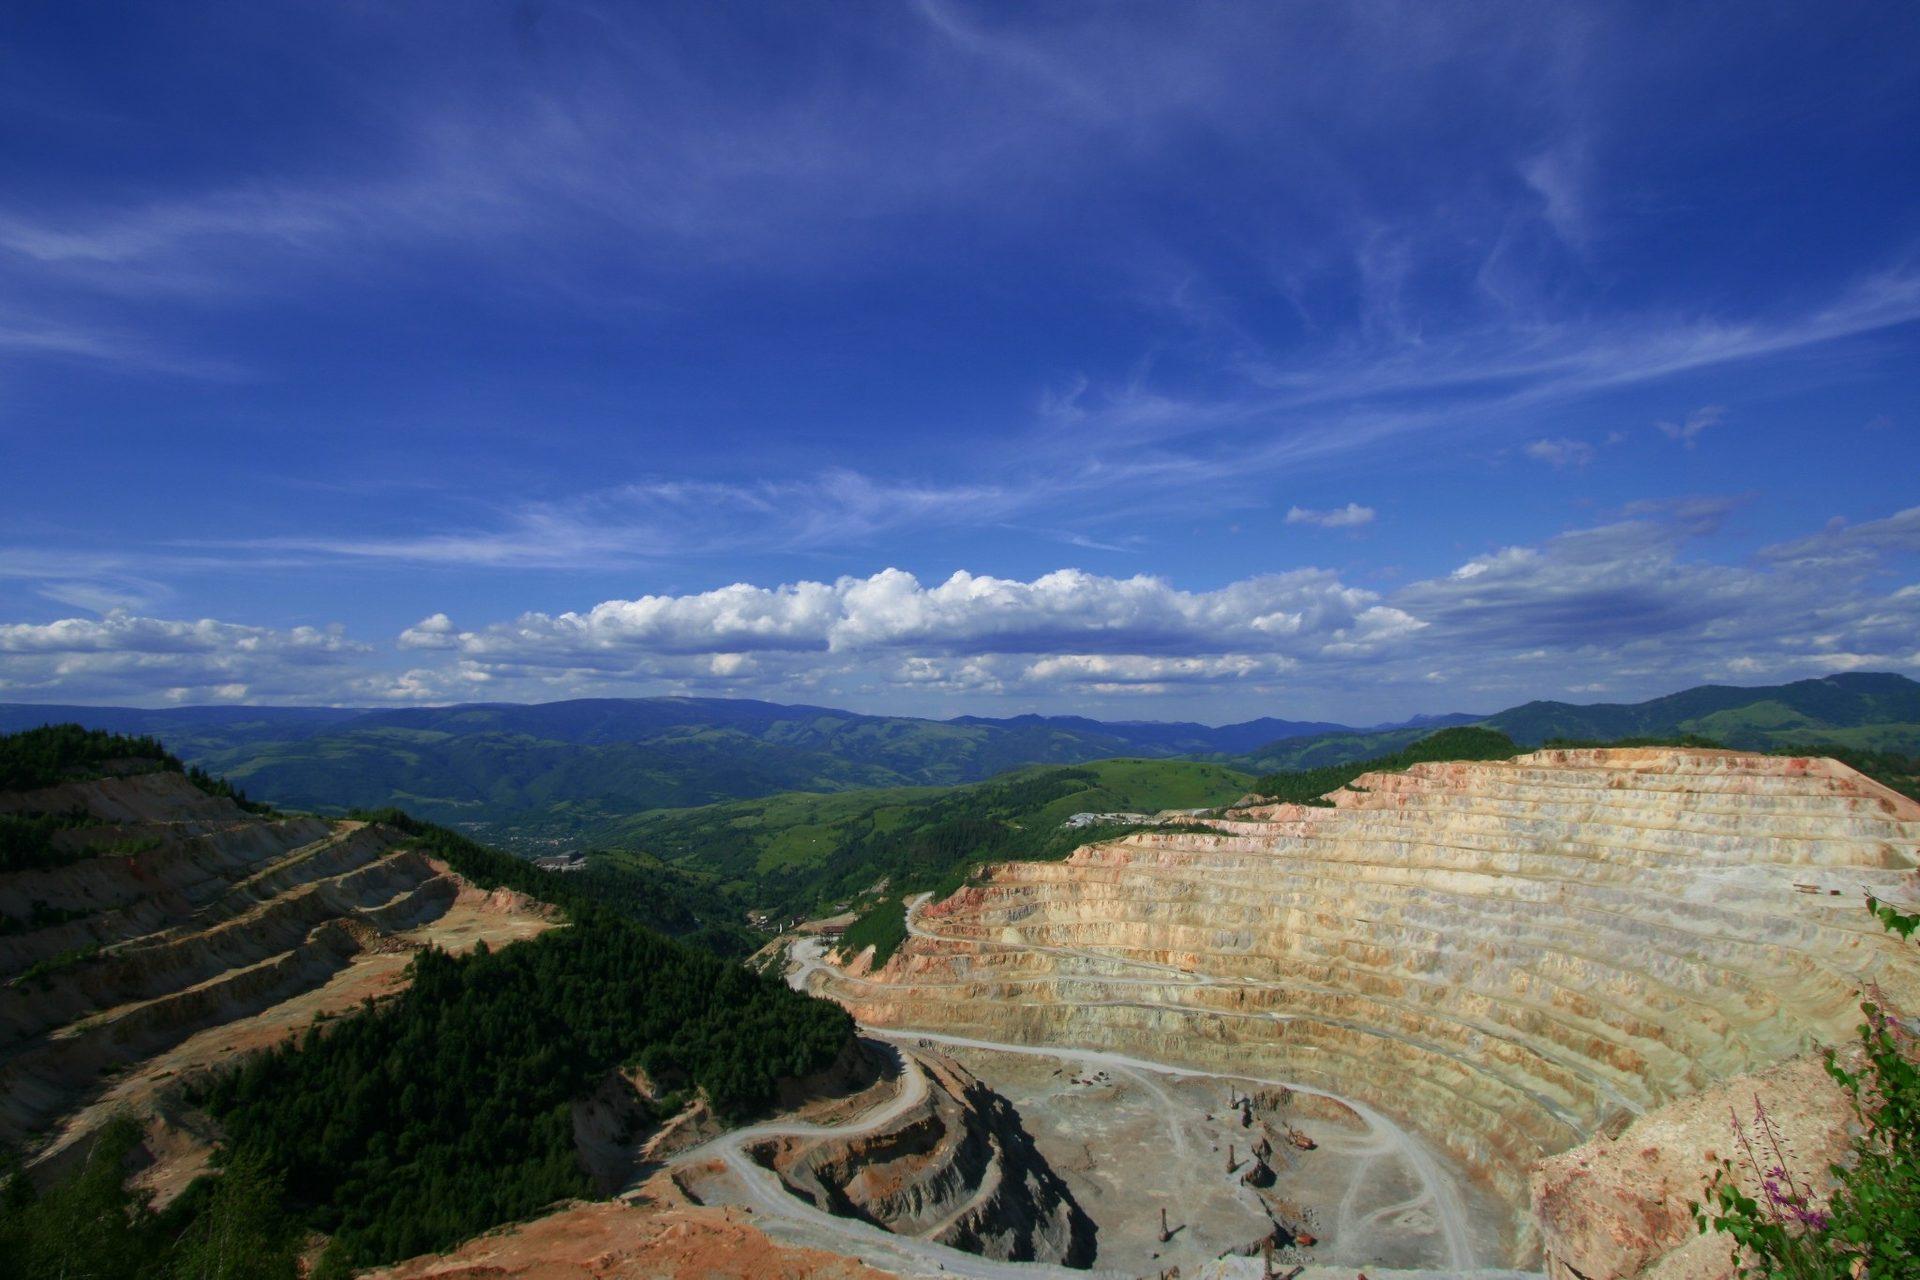
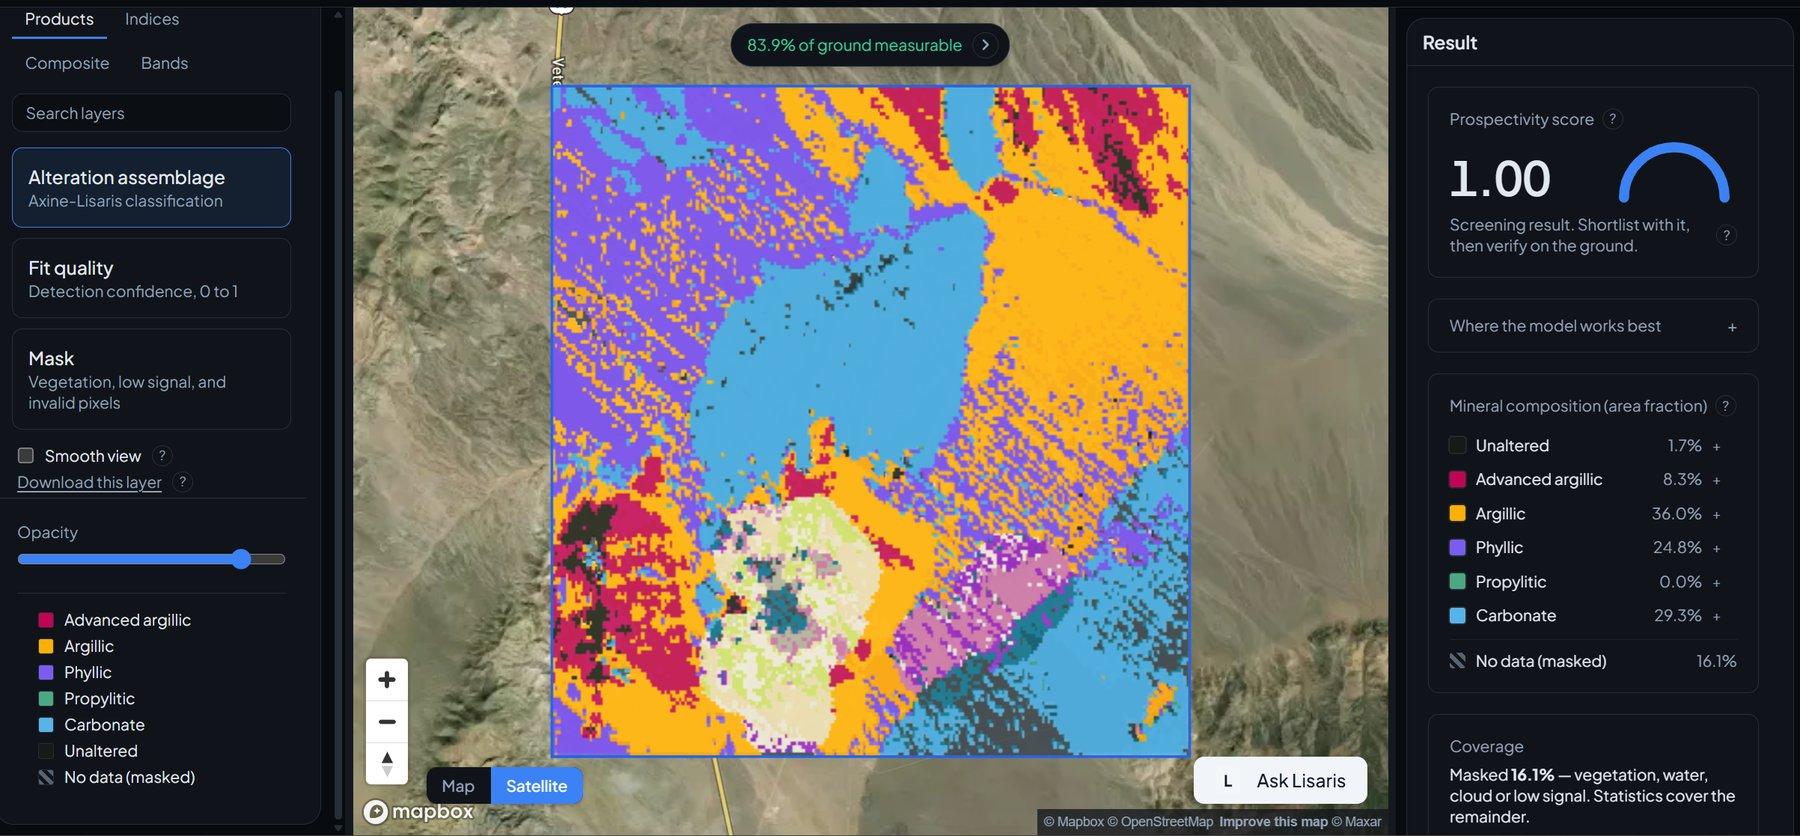
Alteration Mineral Mapping
Per-pixel alteration mineralogy separating advanced argillic, phyllic and propylitic assemblages.
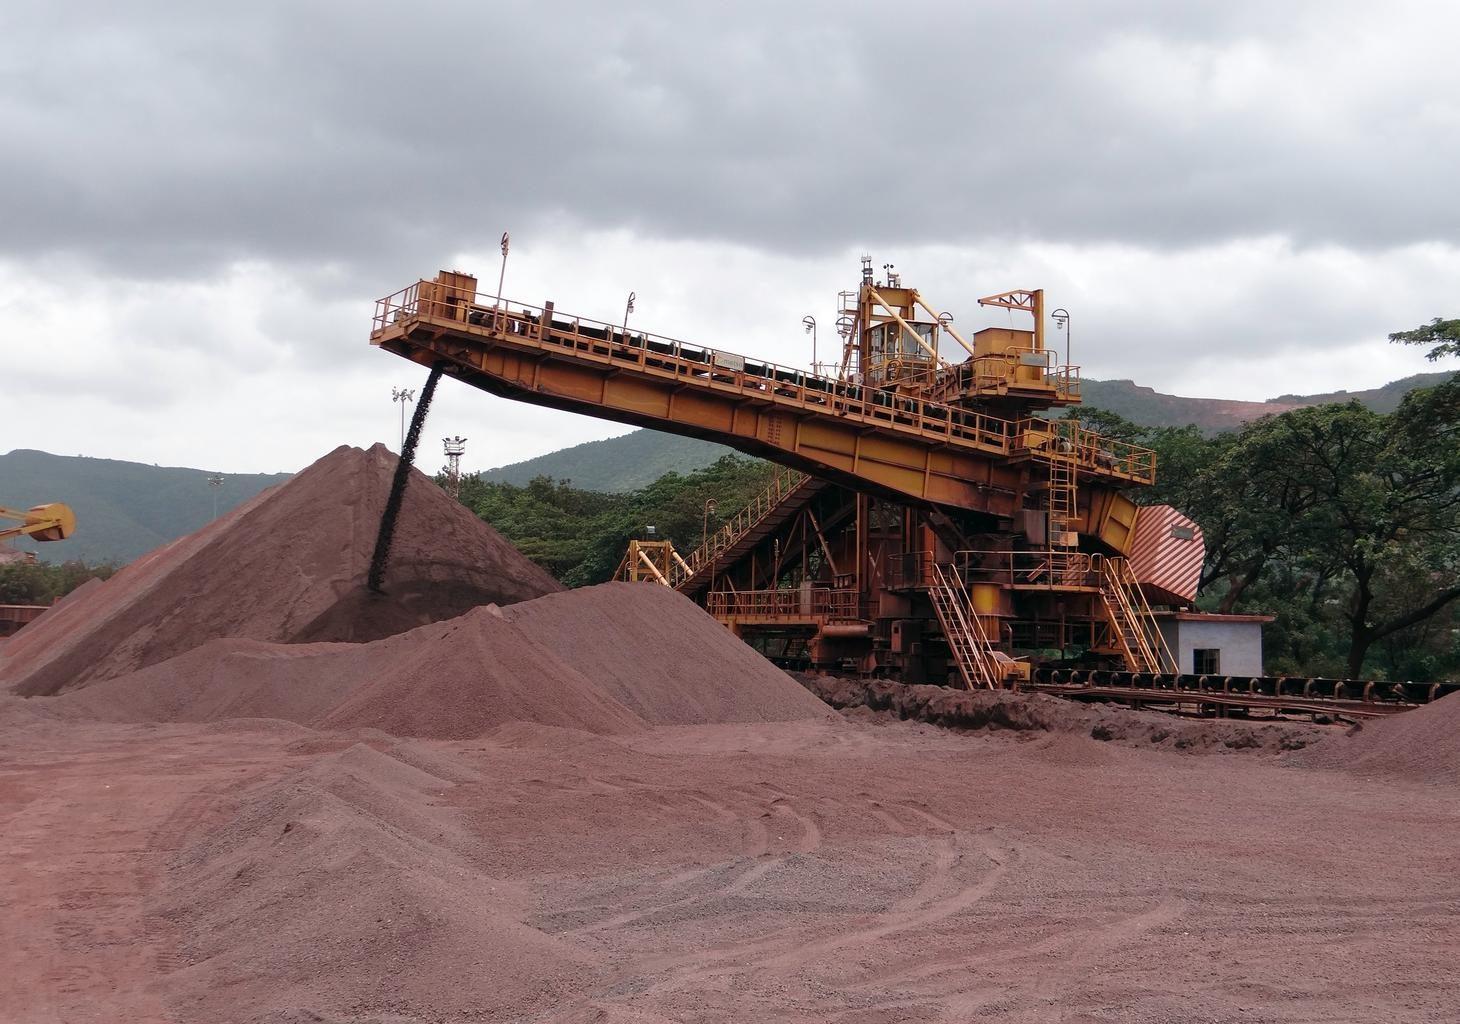
District Prospectivity Ranking
Regional likelihood scoring for hydrothermal systems, backed by leave-one-region-out cross-validation.
Alteration Cluster Detection
Vectorised clustering that pulls out the core hydrothermal hubs and the nodes worth working outward from.
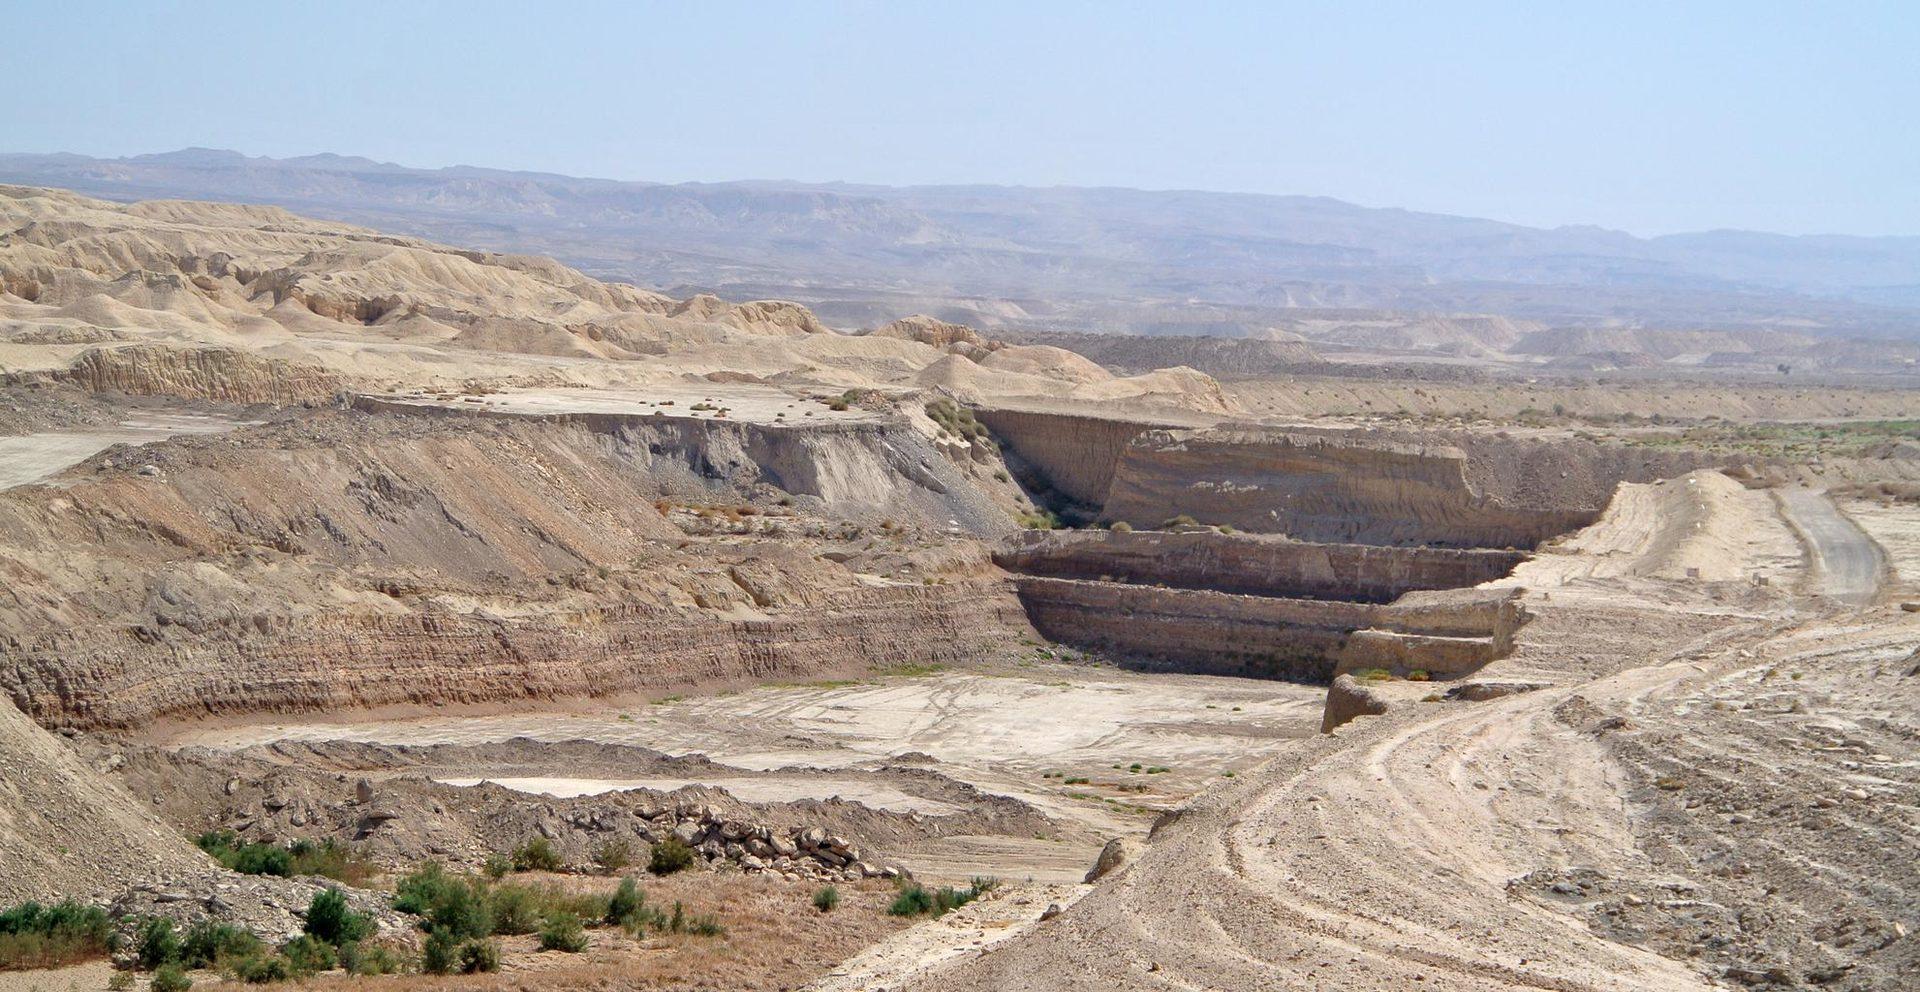
Lithium Pegmatite Index
Maps lithium-bearing mica by how its signature differs from ordinary white mica.
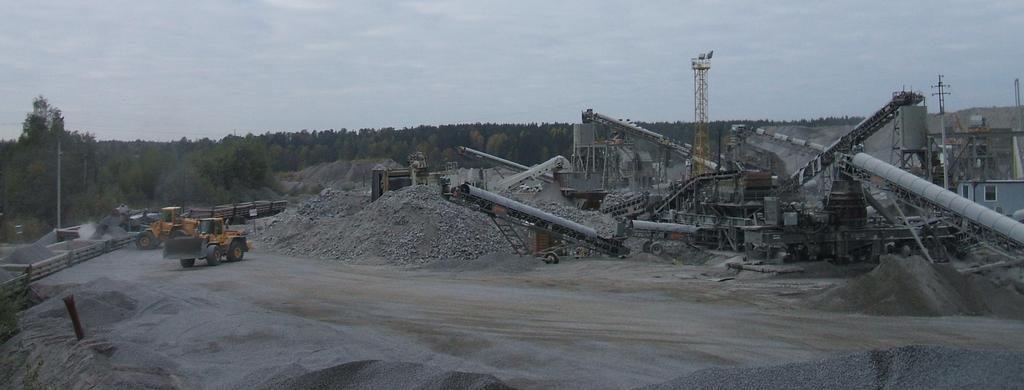
Gossan & Iron Oxide Speciation
Separates hematite from goethite, and reports the related iron-hydroxyl reading as a ferric class.
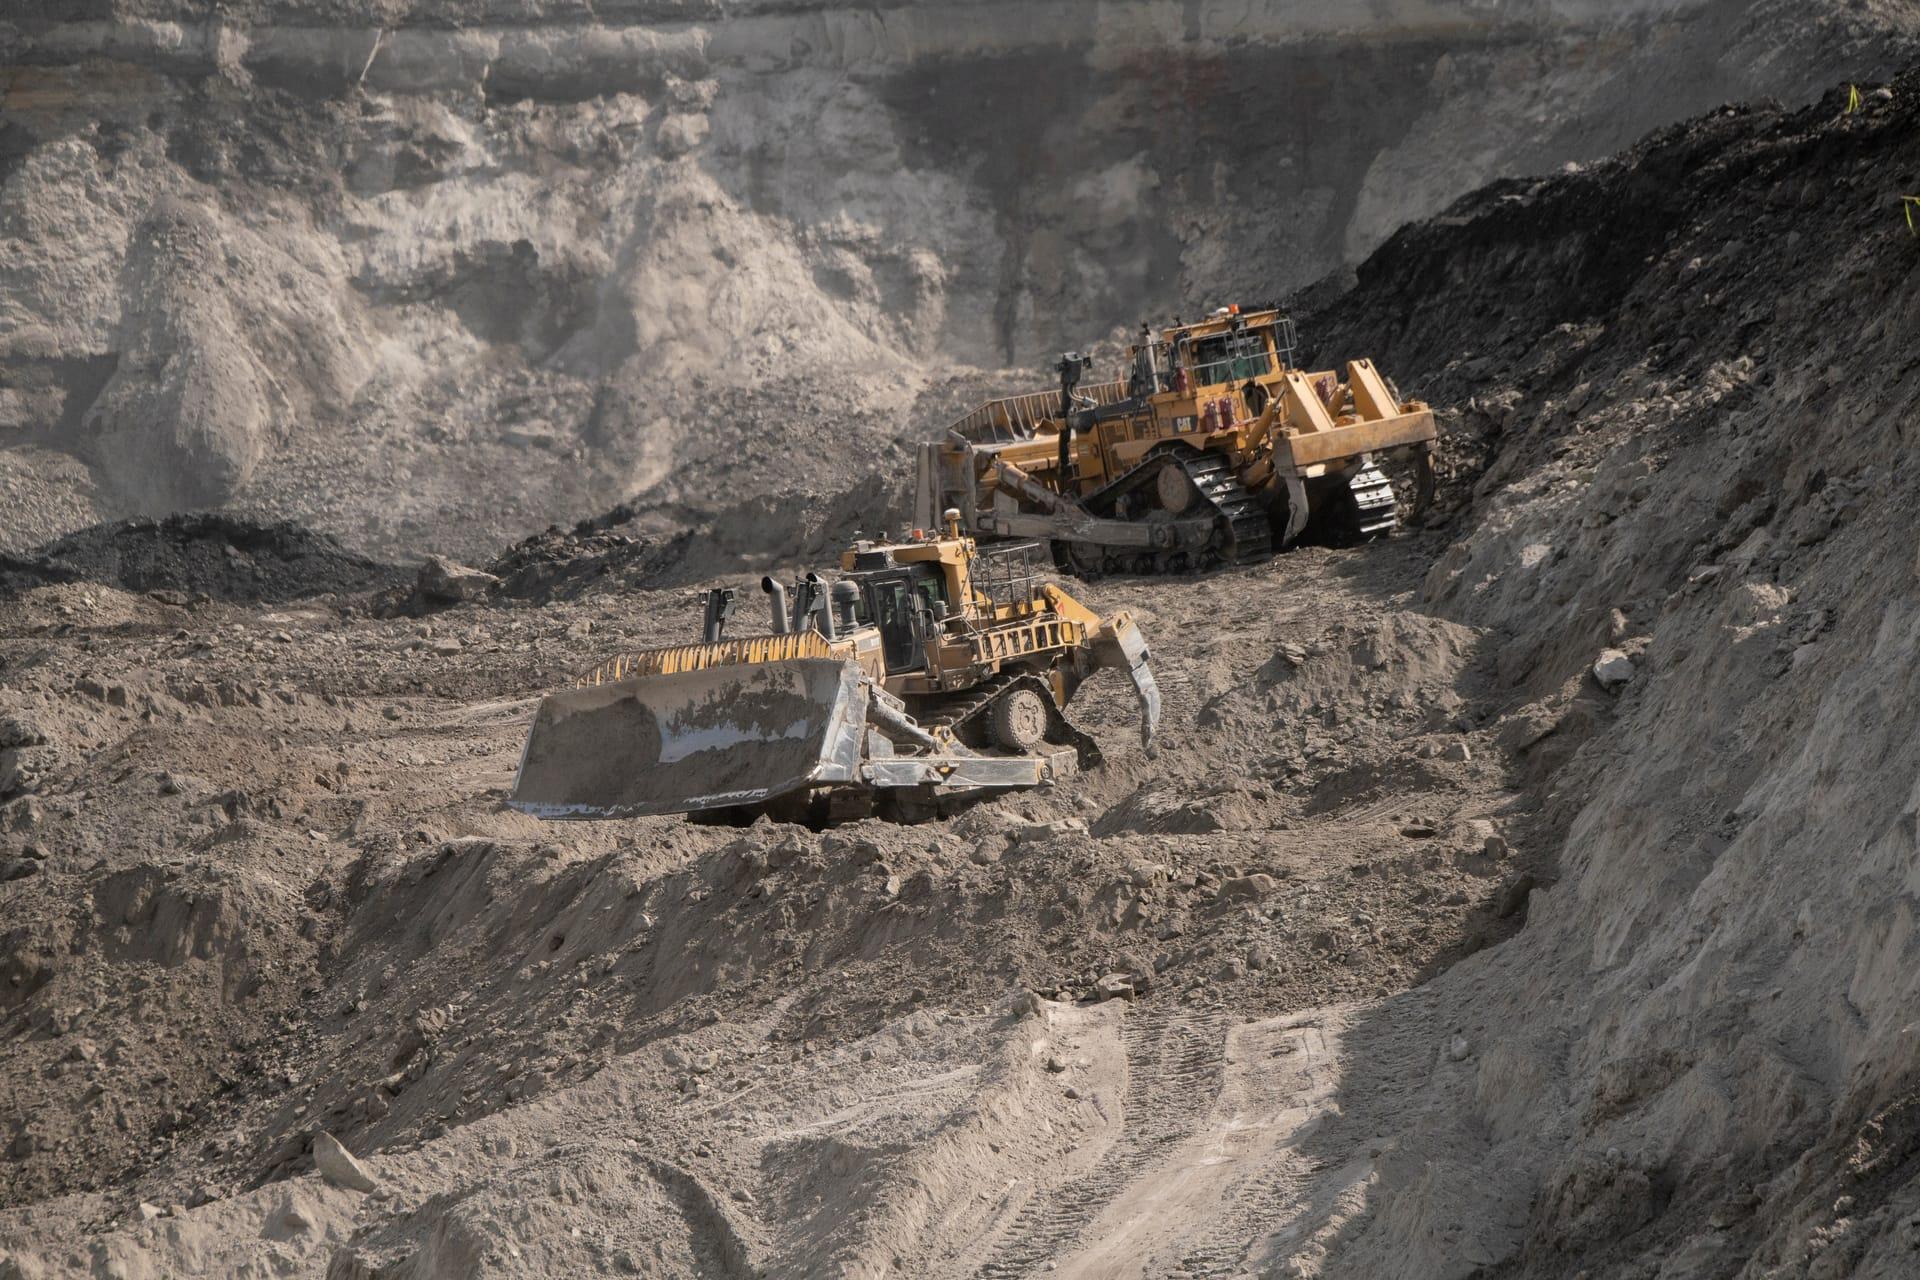
Porphyry Cu-Au Vectoring
Vectors toward the hydrothermal centre by tracking how white mica composition shifts across the district.
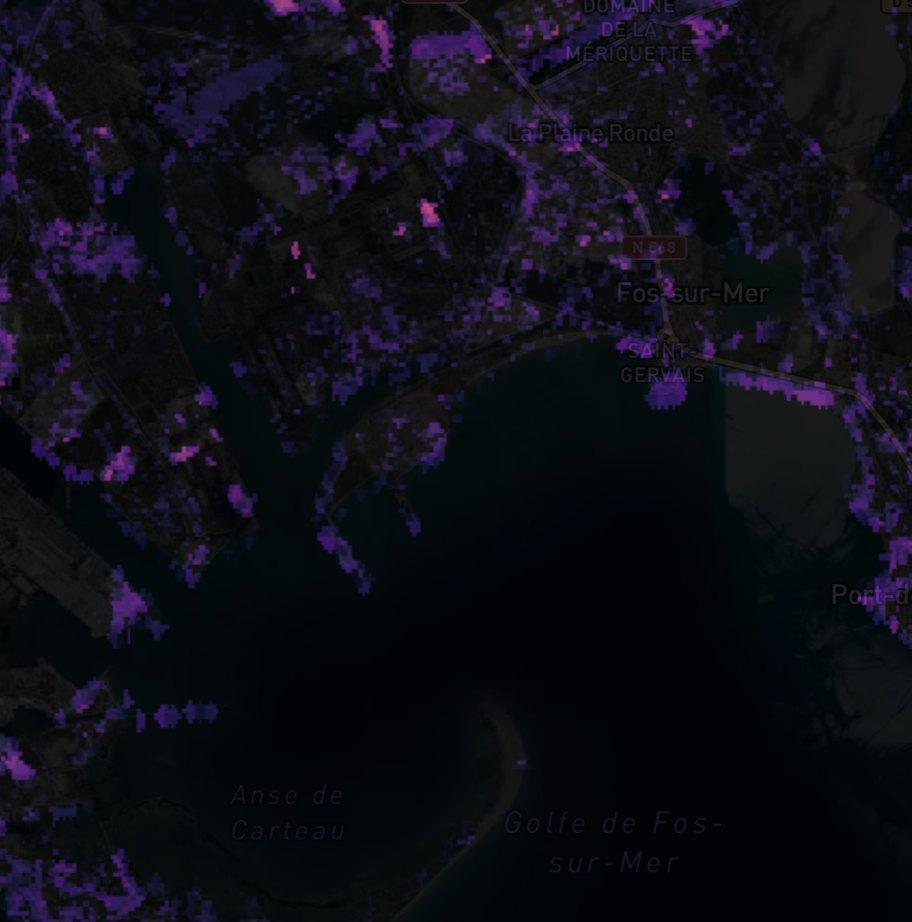
Methane Plume Detection
Column enhancement over oil and gas facilities. Reviewed public plume products pass through with their provenance, and our own filter runs alongside as screening.
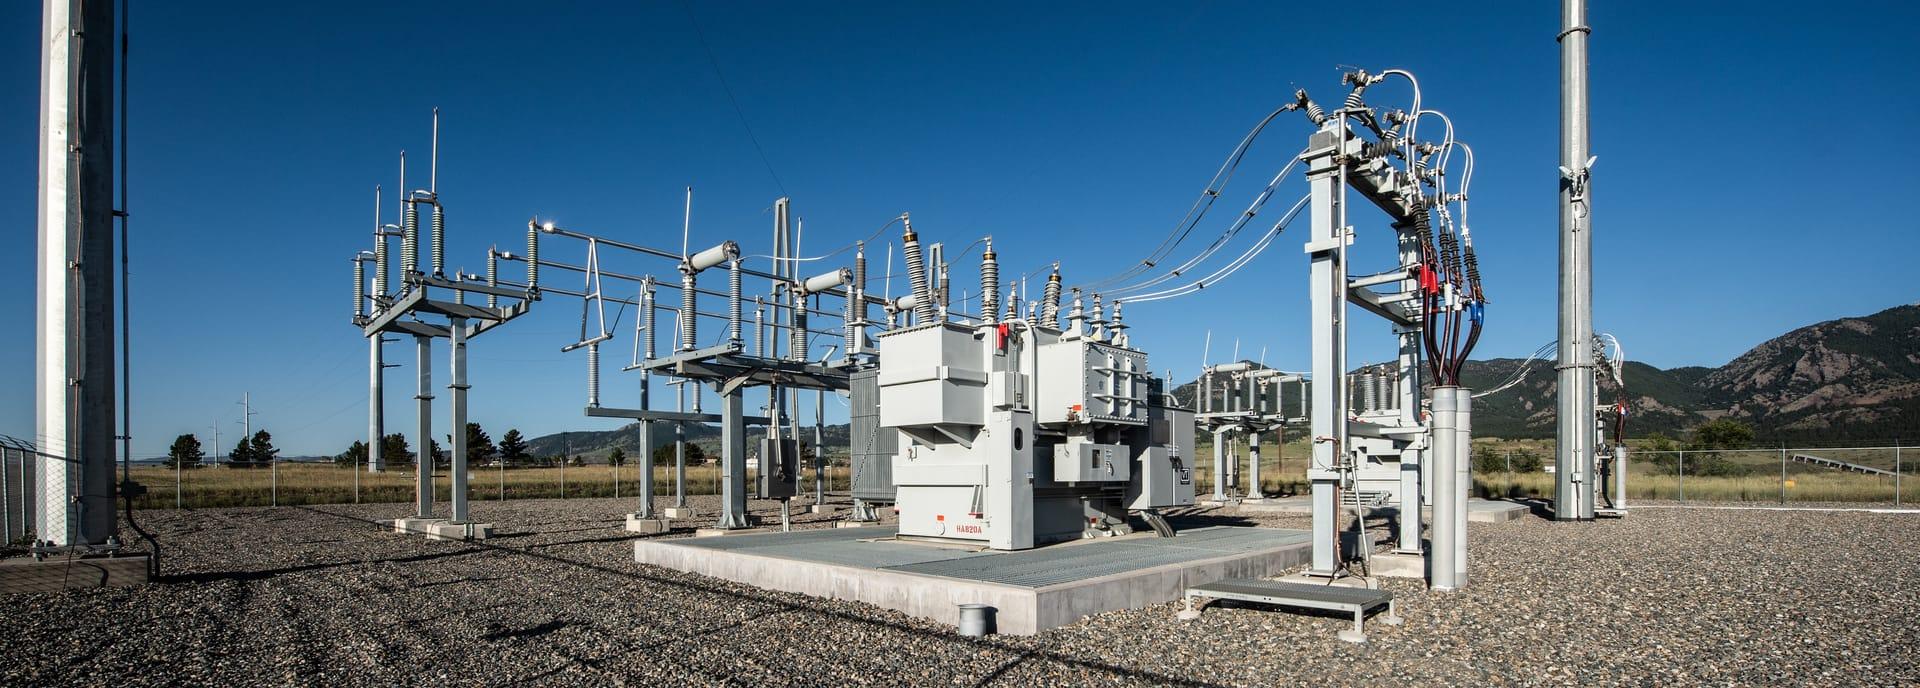
Geothermal Cap Mapping
Finds active and fossil reservoir caps through ammonium minerals, alunite and silica sinter.

Hydrocarbon Microseepage
Surface alteration patterns above petroleum basins, reported as indicators rather than as a find.
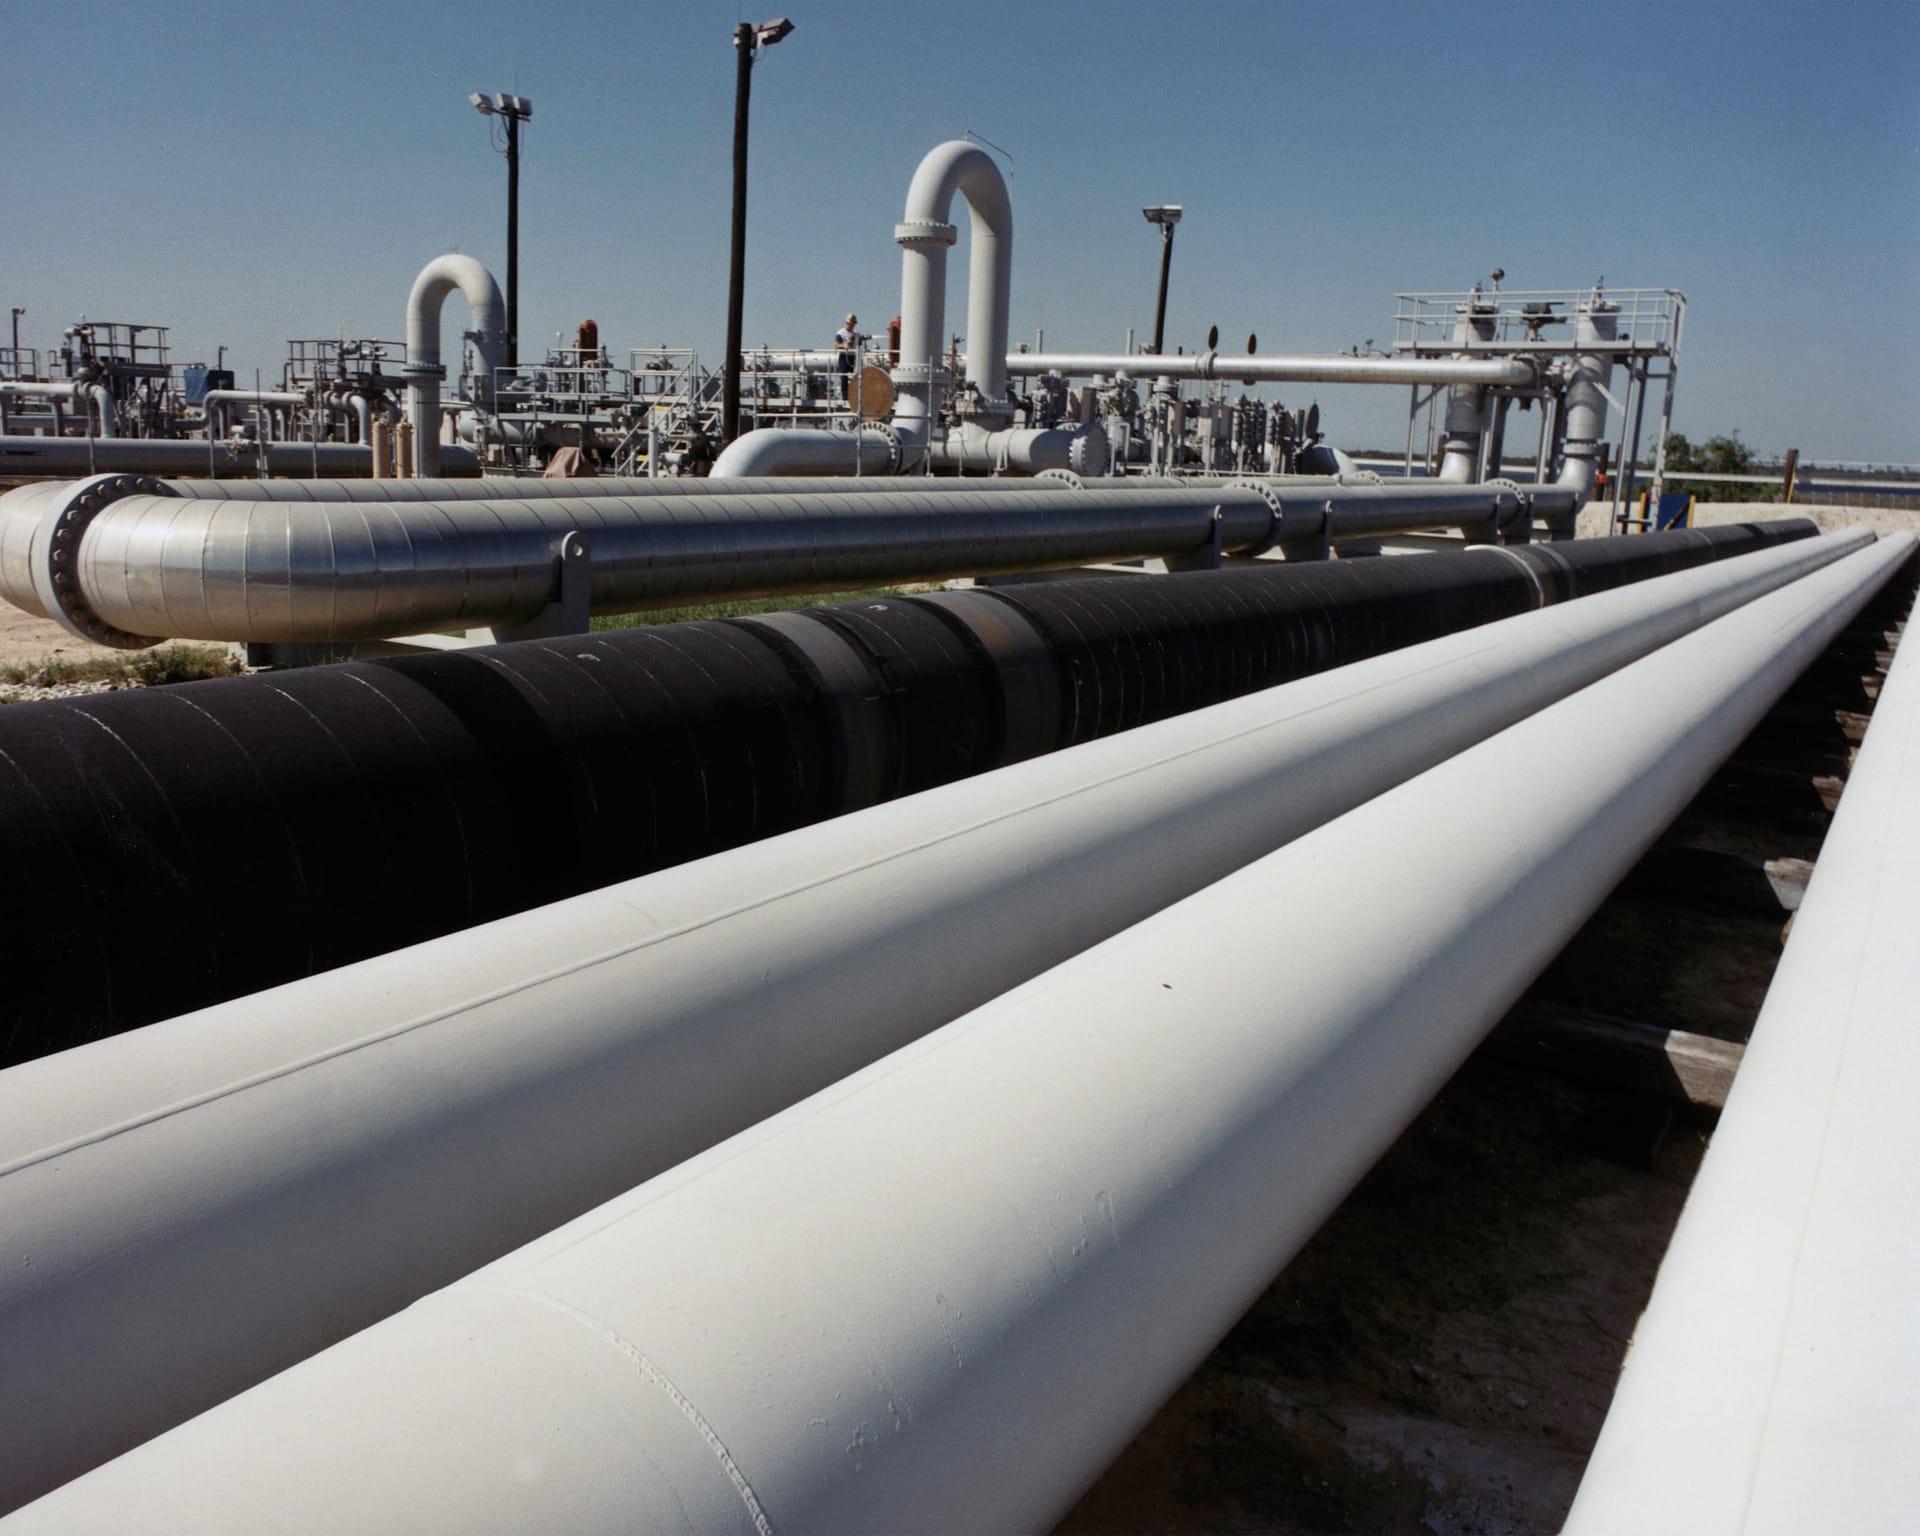
Pipeline Corridor Terrain Stability
Tracks swelling clays and moisture along a corridor, so crews go where the ground actually moved.
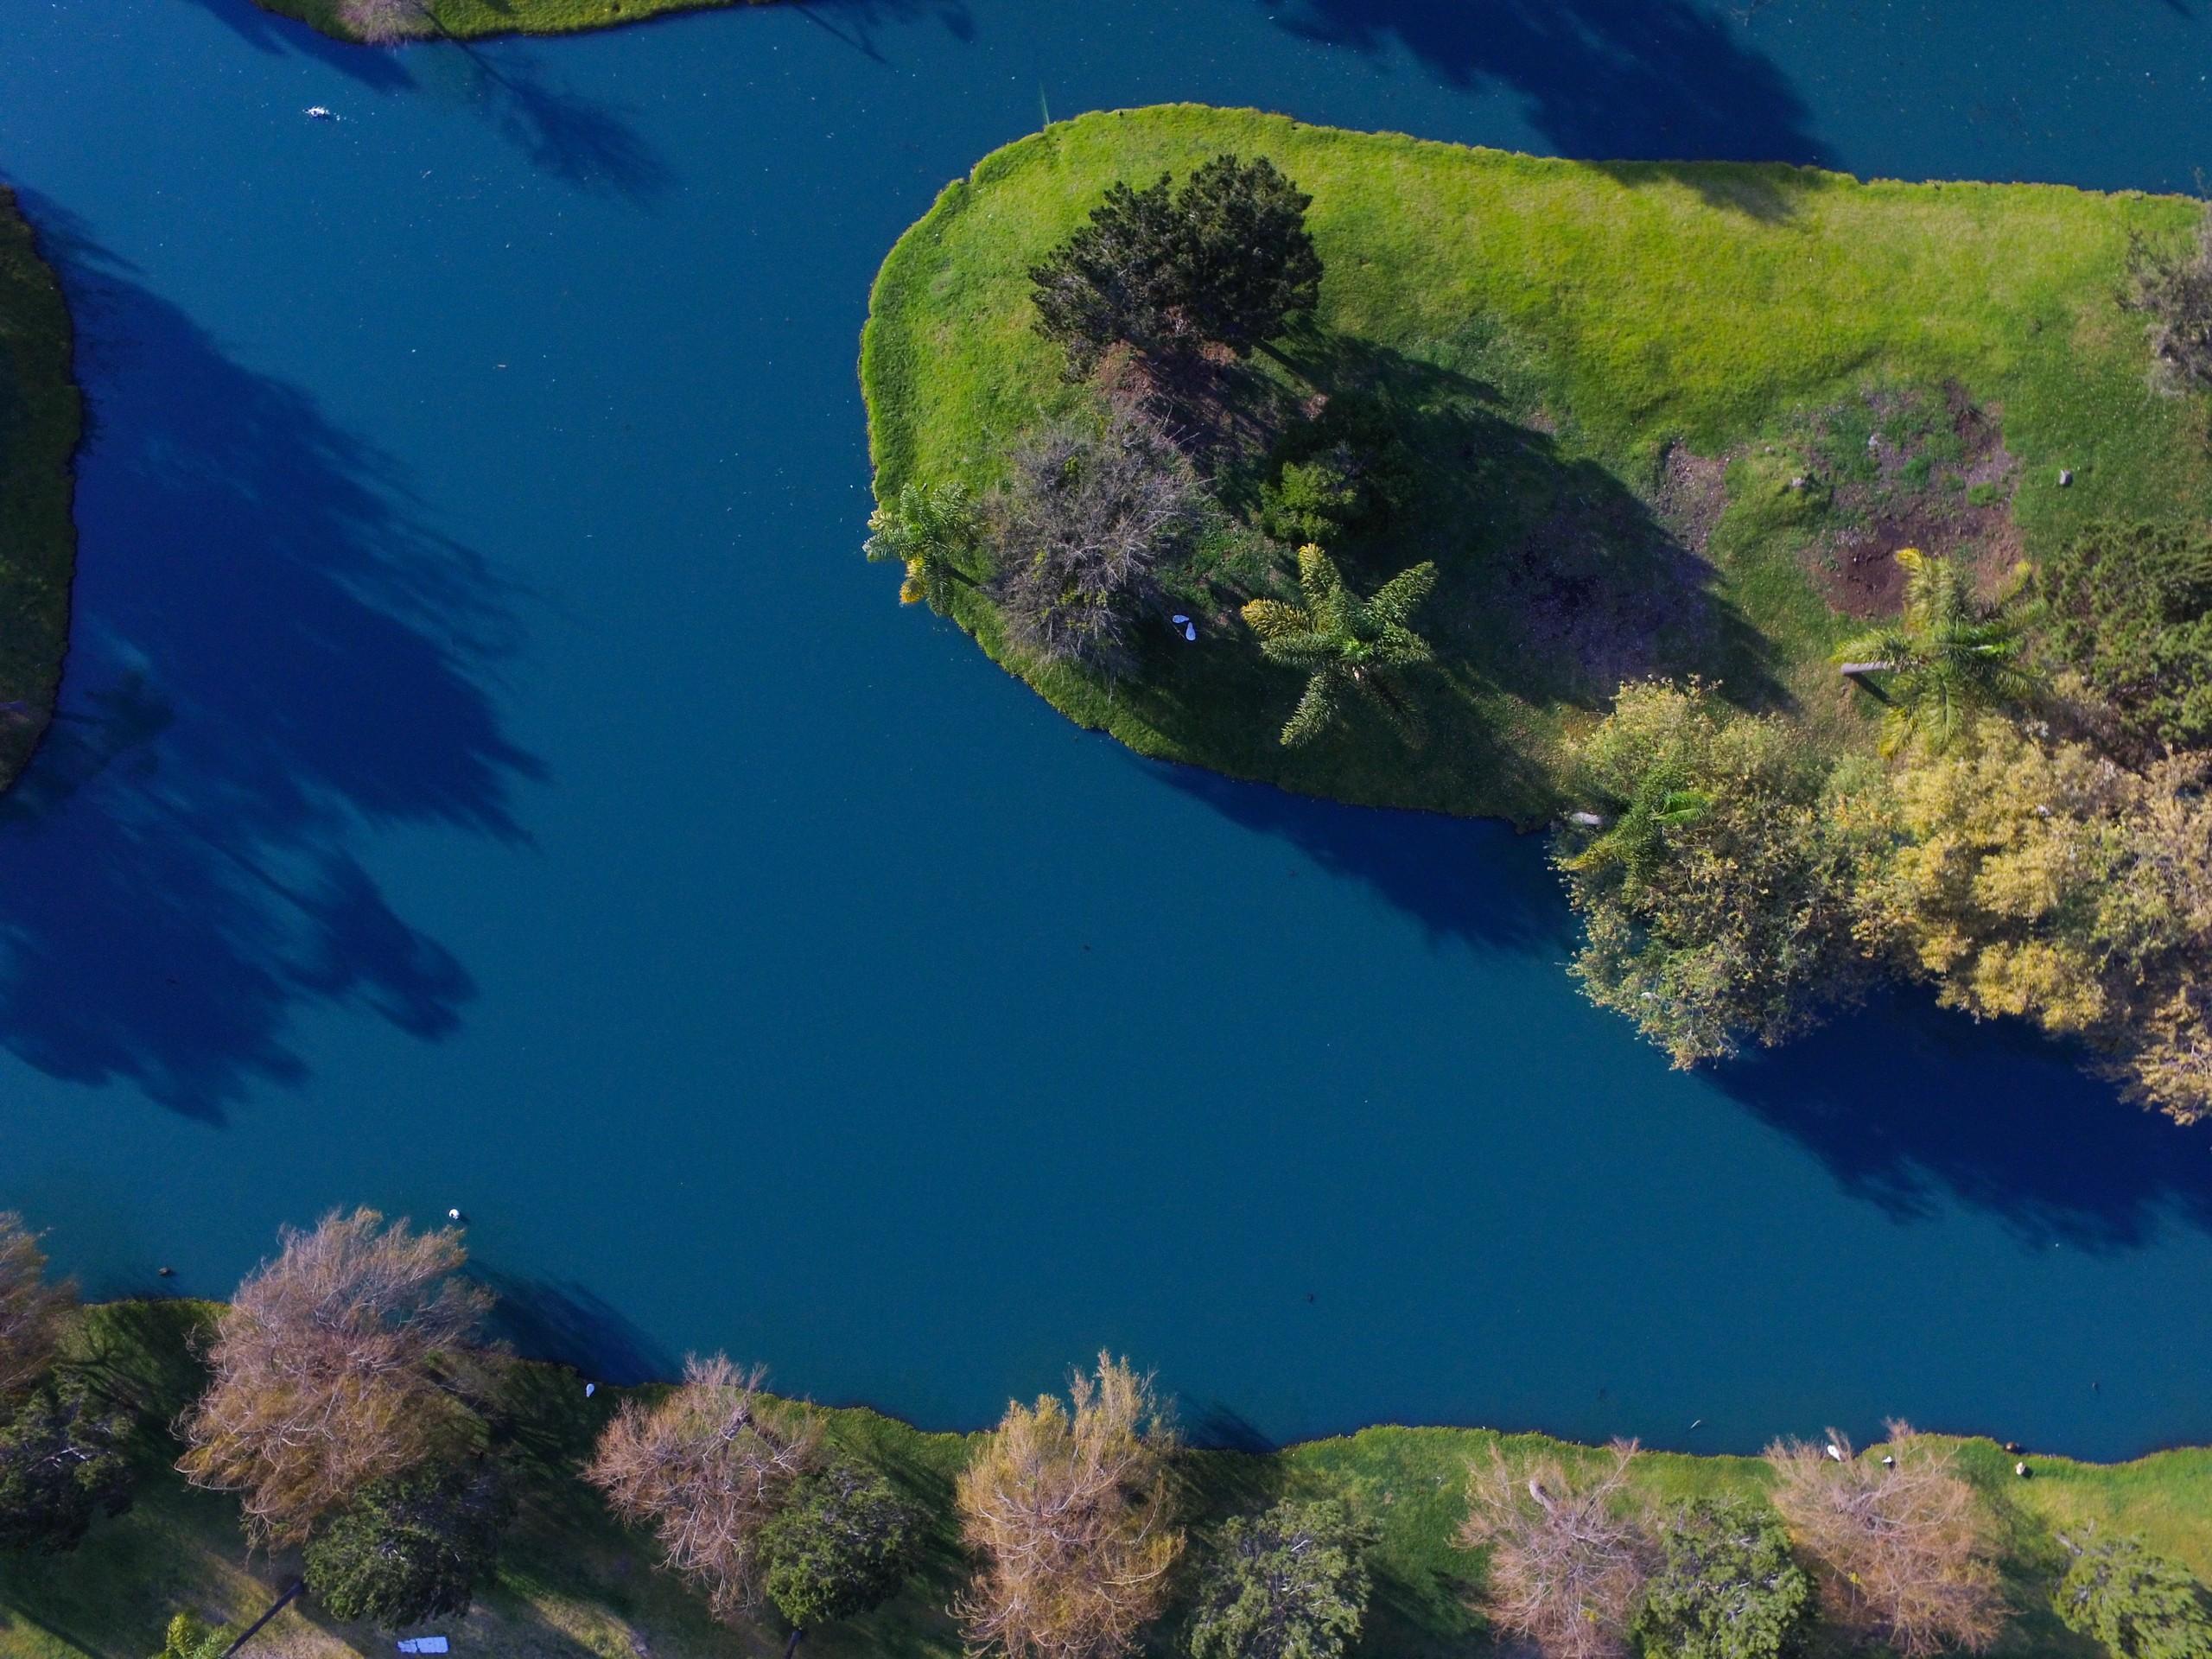
Surface Water Quality
Screening for pigment and turbidity over inland water, using published fits applied unchanged.
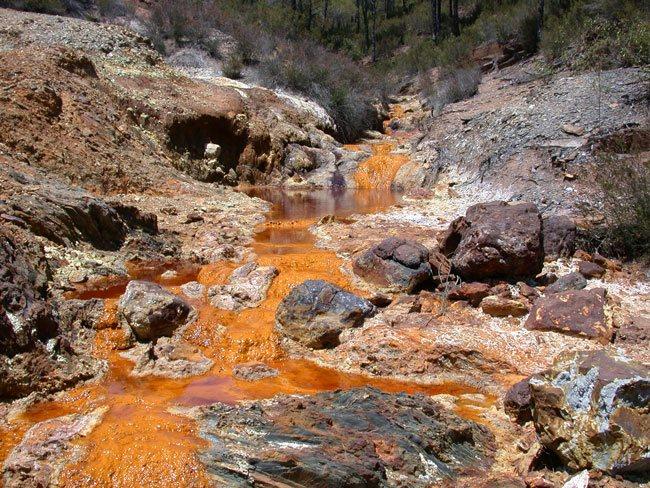
Acid Drainage Screening
Screening for precipitate coatings along discharge channels, with a ferric floor gating the read.
Thermal Water Discharge Anomaly
Brightness temperature contrast at discharge points, against a local baseline drawn from the surrounding water.
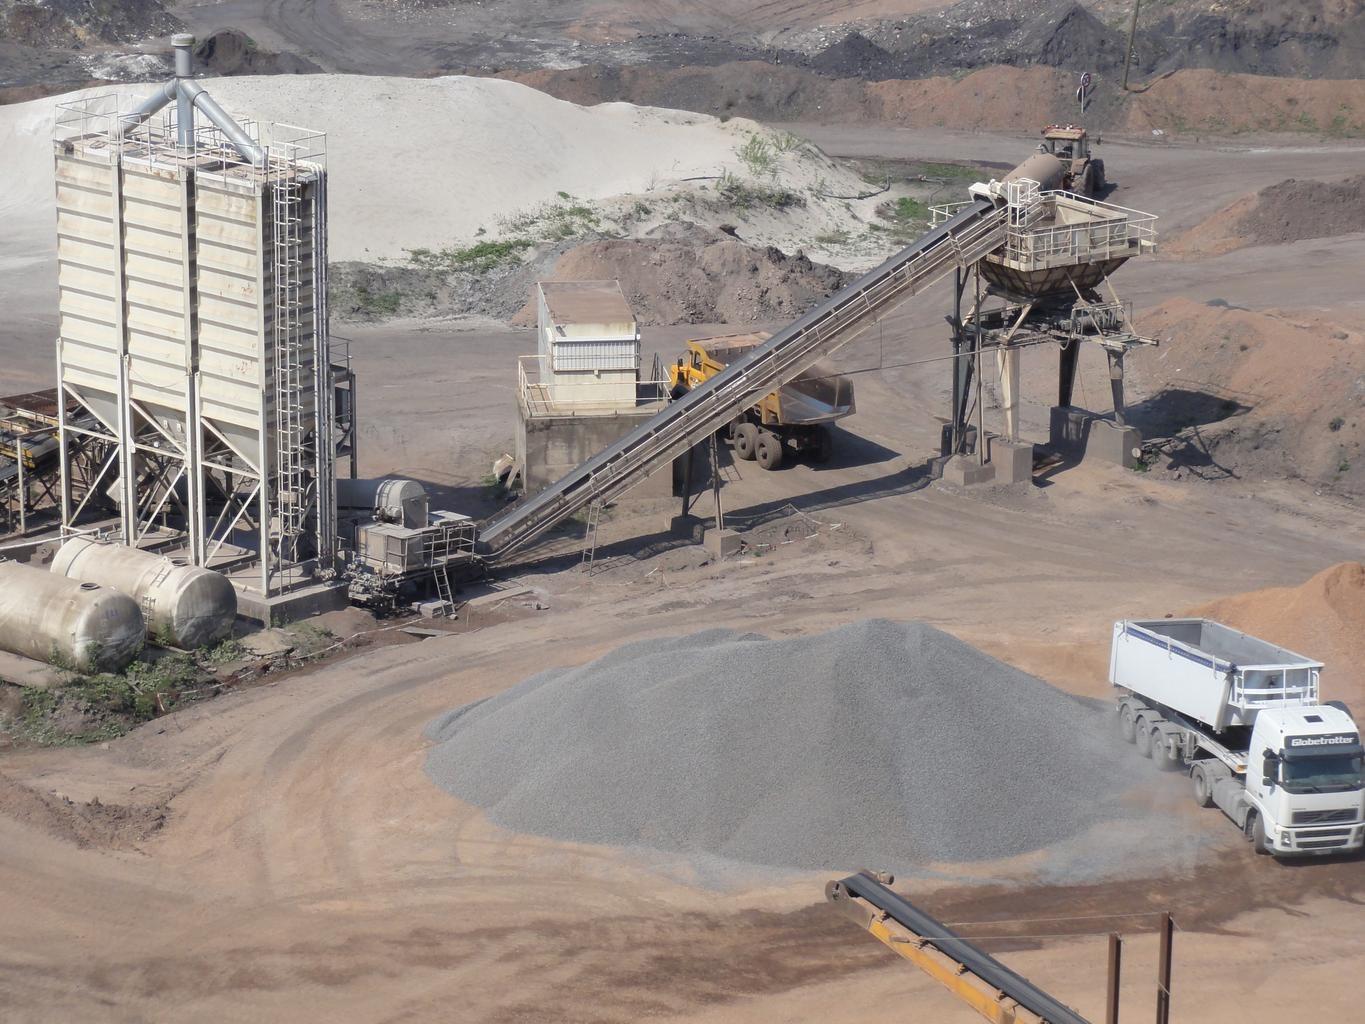
Tailings Dam Stability & Seepage
Monitors moisture and sulfate weathering on exposed embankment faces, differenced across dates.
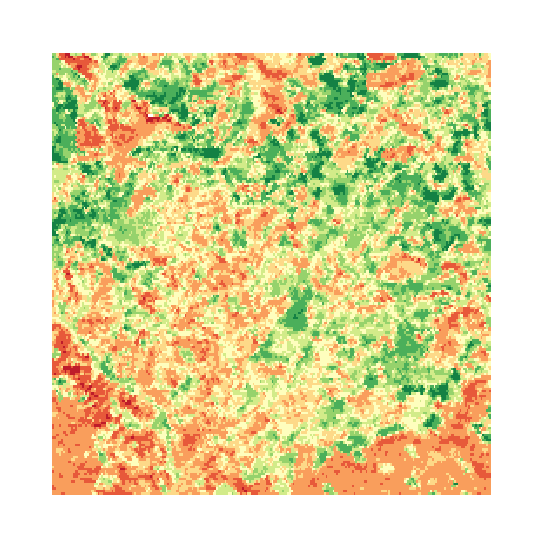
Canopy Stress Screening
Foliar water content, measured against a dry-matter baseline and compared across acquisitions.
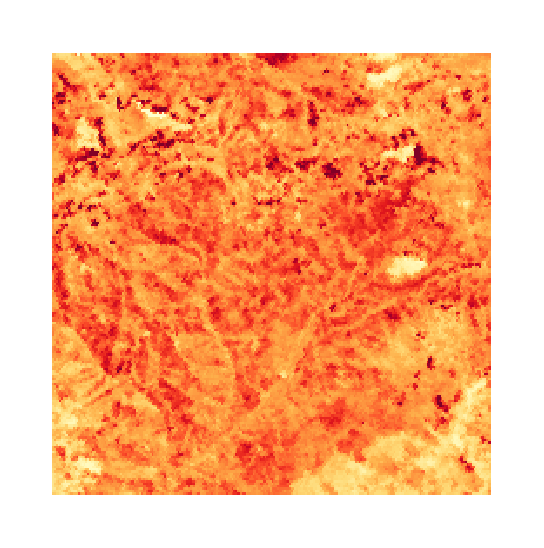
Canopy Chlorophyll & Red-Edge
Red-edge position, which follows canopy pigment. Refused on sensors that cannot resolve it.
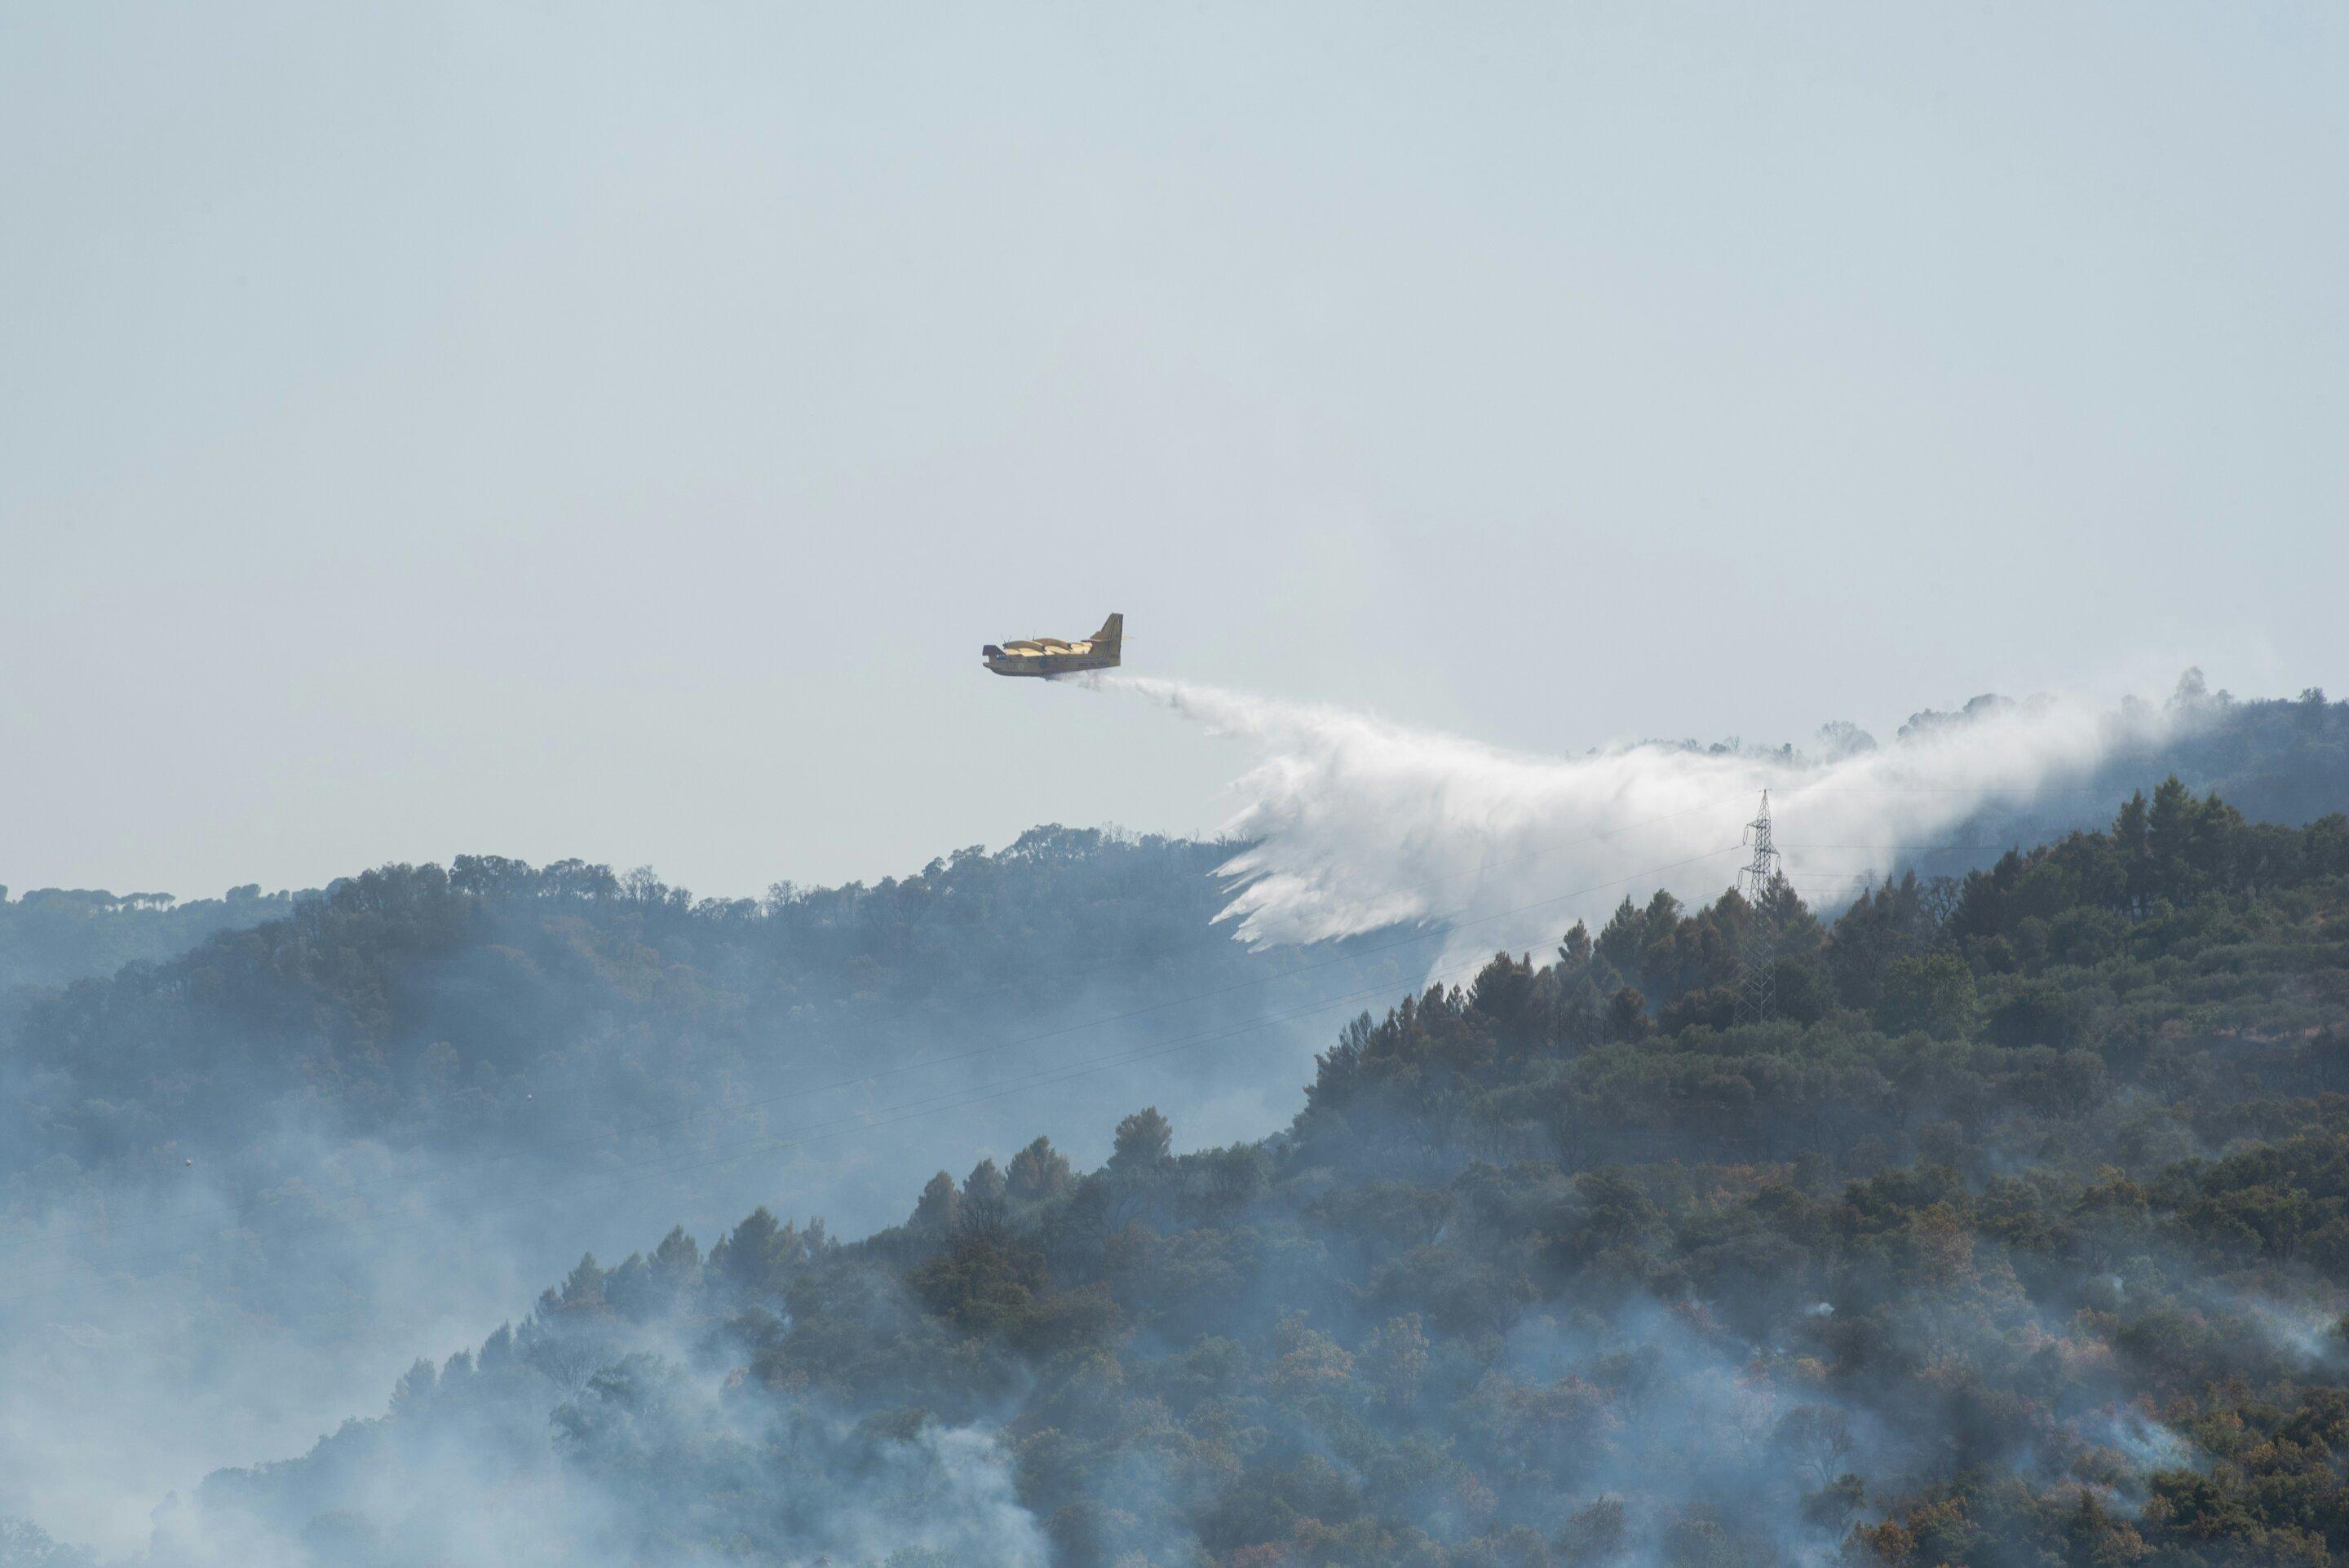
Wildfire Burn Severity & Recovery
Burn severity between paired dates, with char and ash unmixed so a partly burned pixel reads as partly burned.

Selective Logging Audit
Sub-pixel unmixing for skid trails, canopy gap disturbance and harvest compliance over a concession.
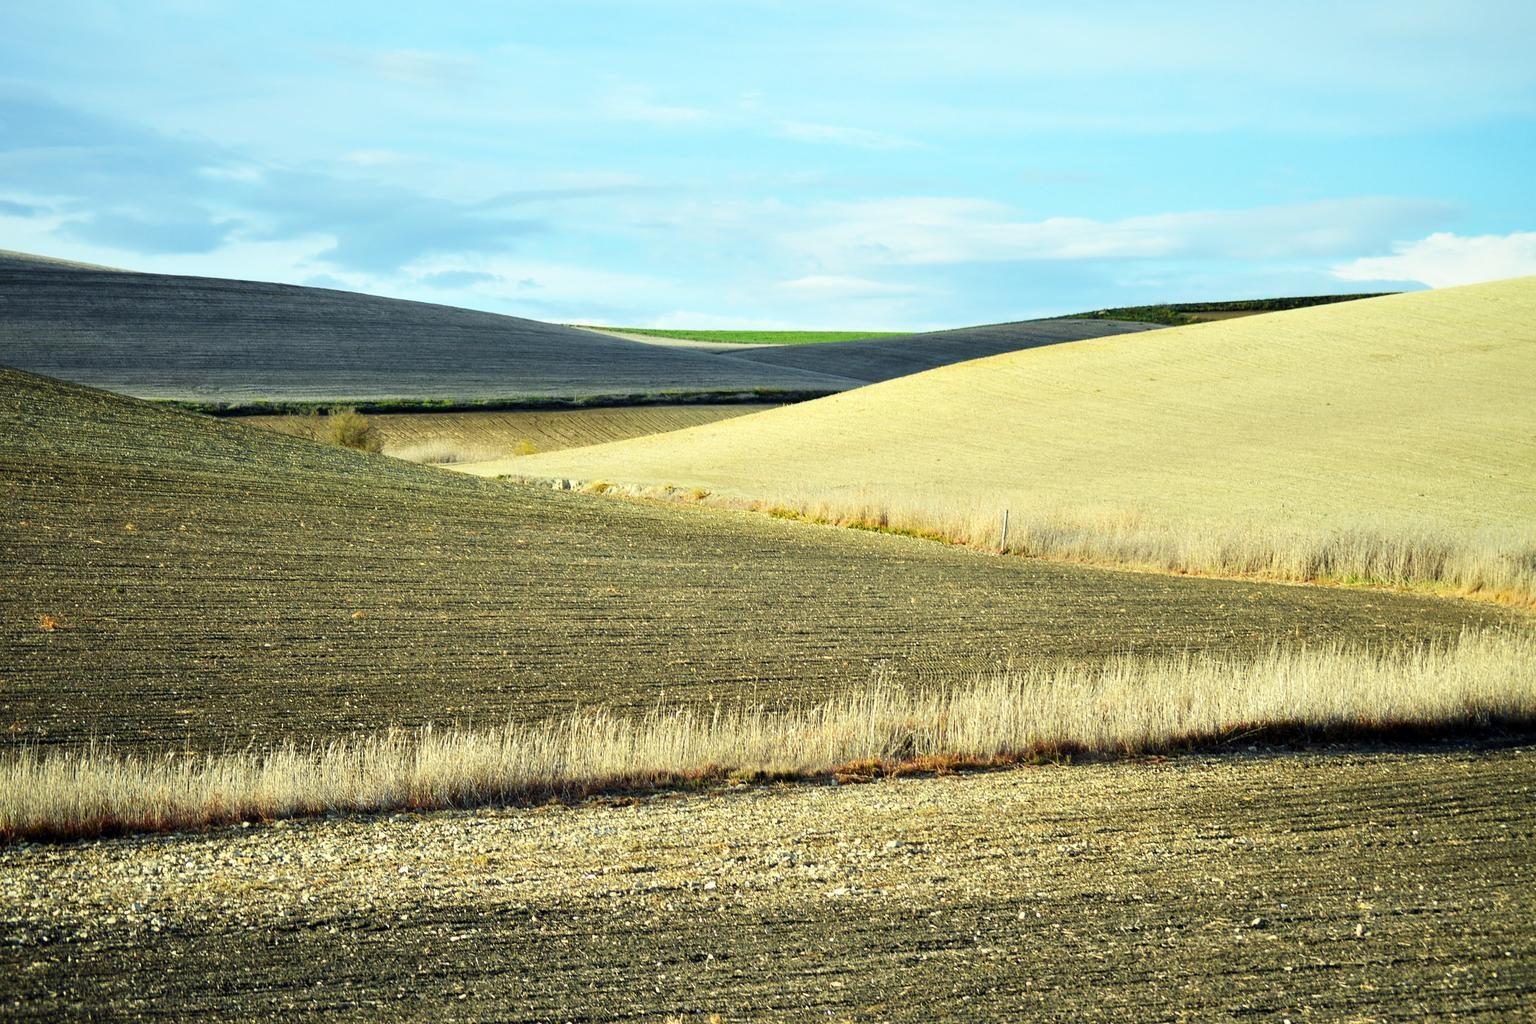
Soil Exposure & Crop Residue
Crop residue cover and topsoil clay, for residue and tillage classes.
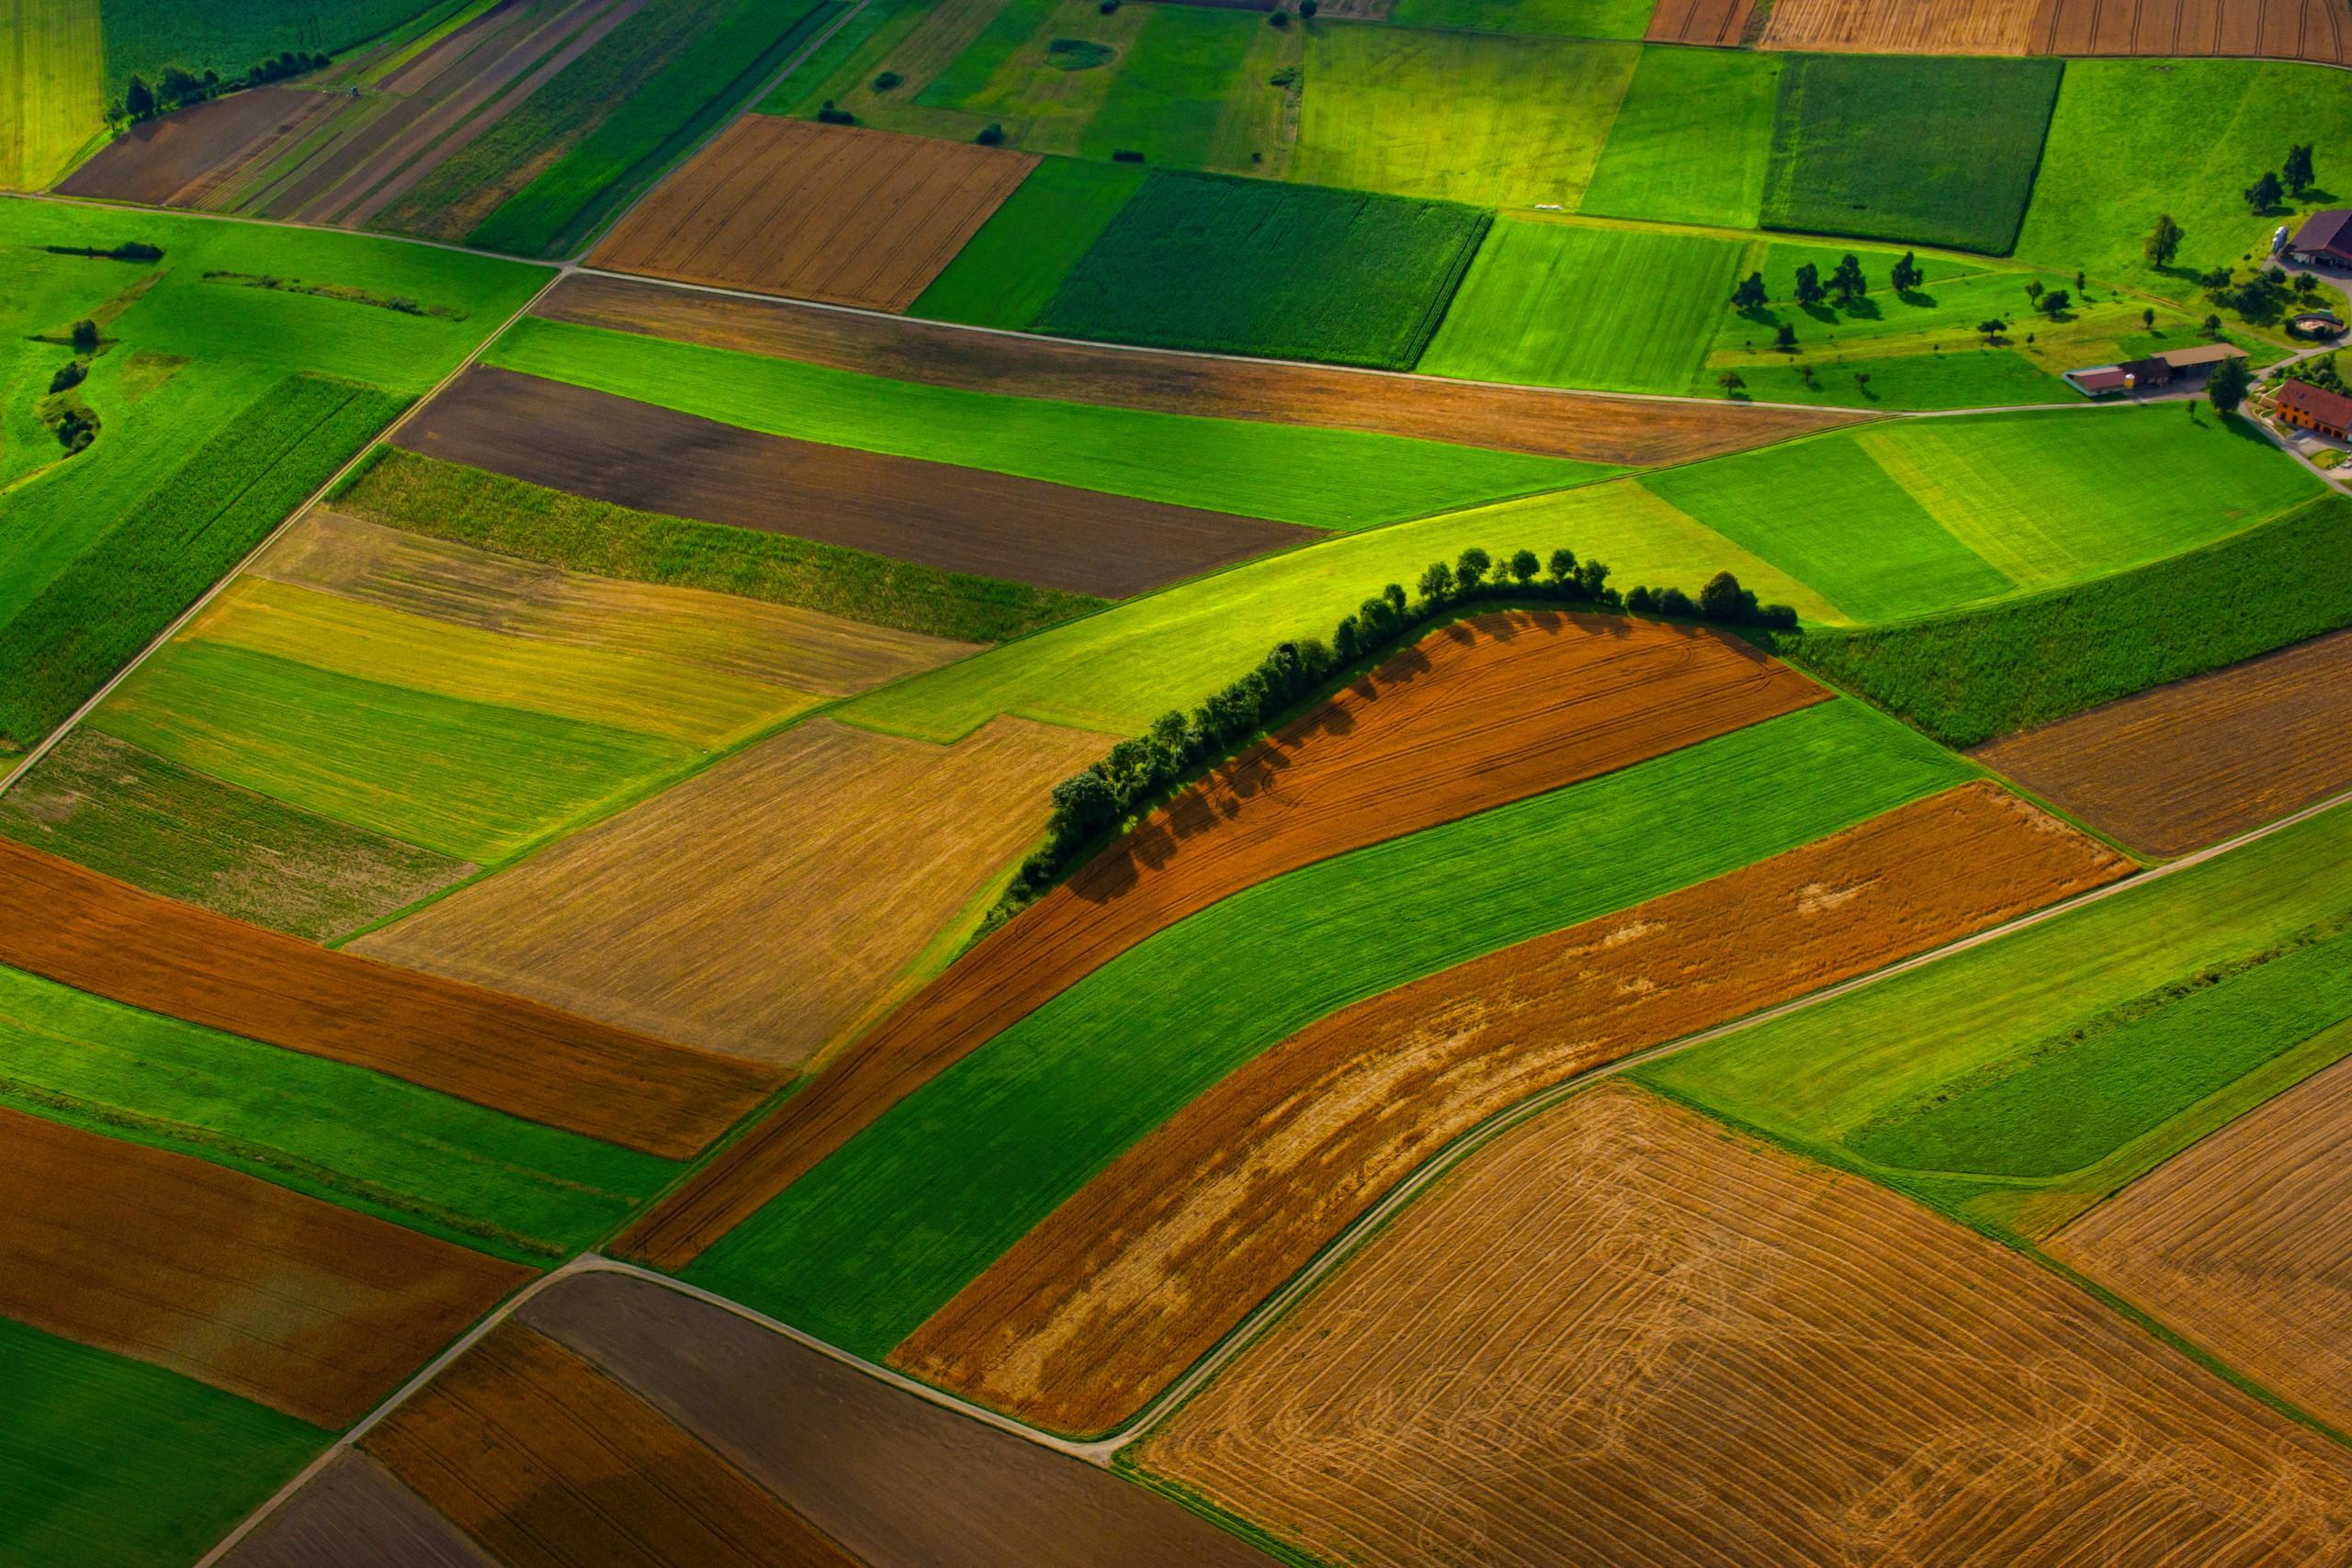
Soil Organic Carbon Proxy
Each pixel is composited to the moment it was most exposed, then ranked for organic matter. No carbon content is reported.
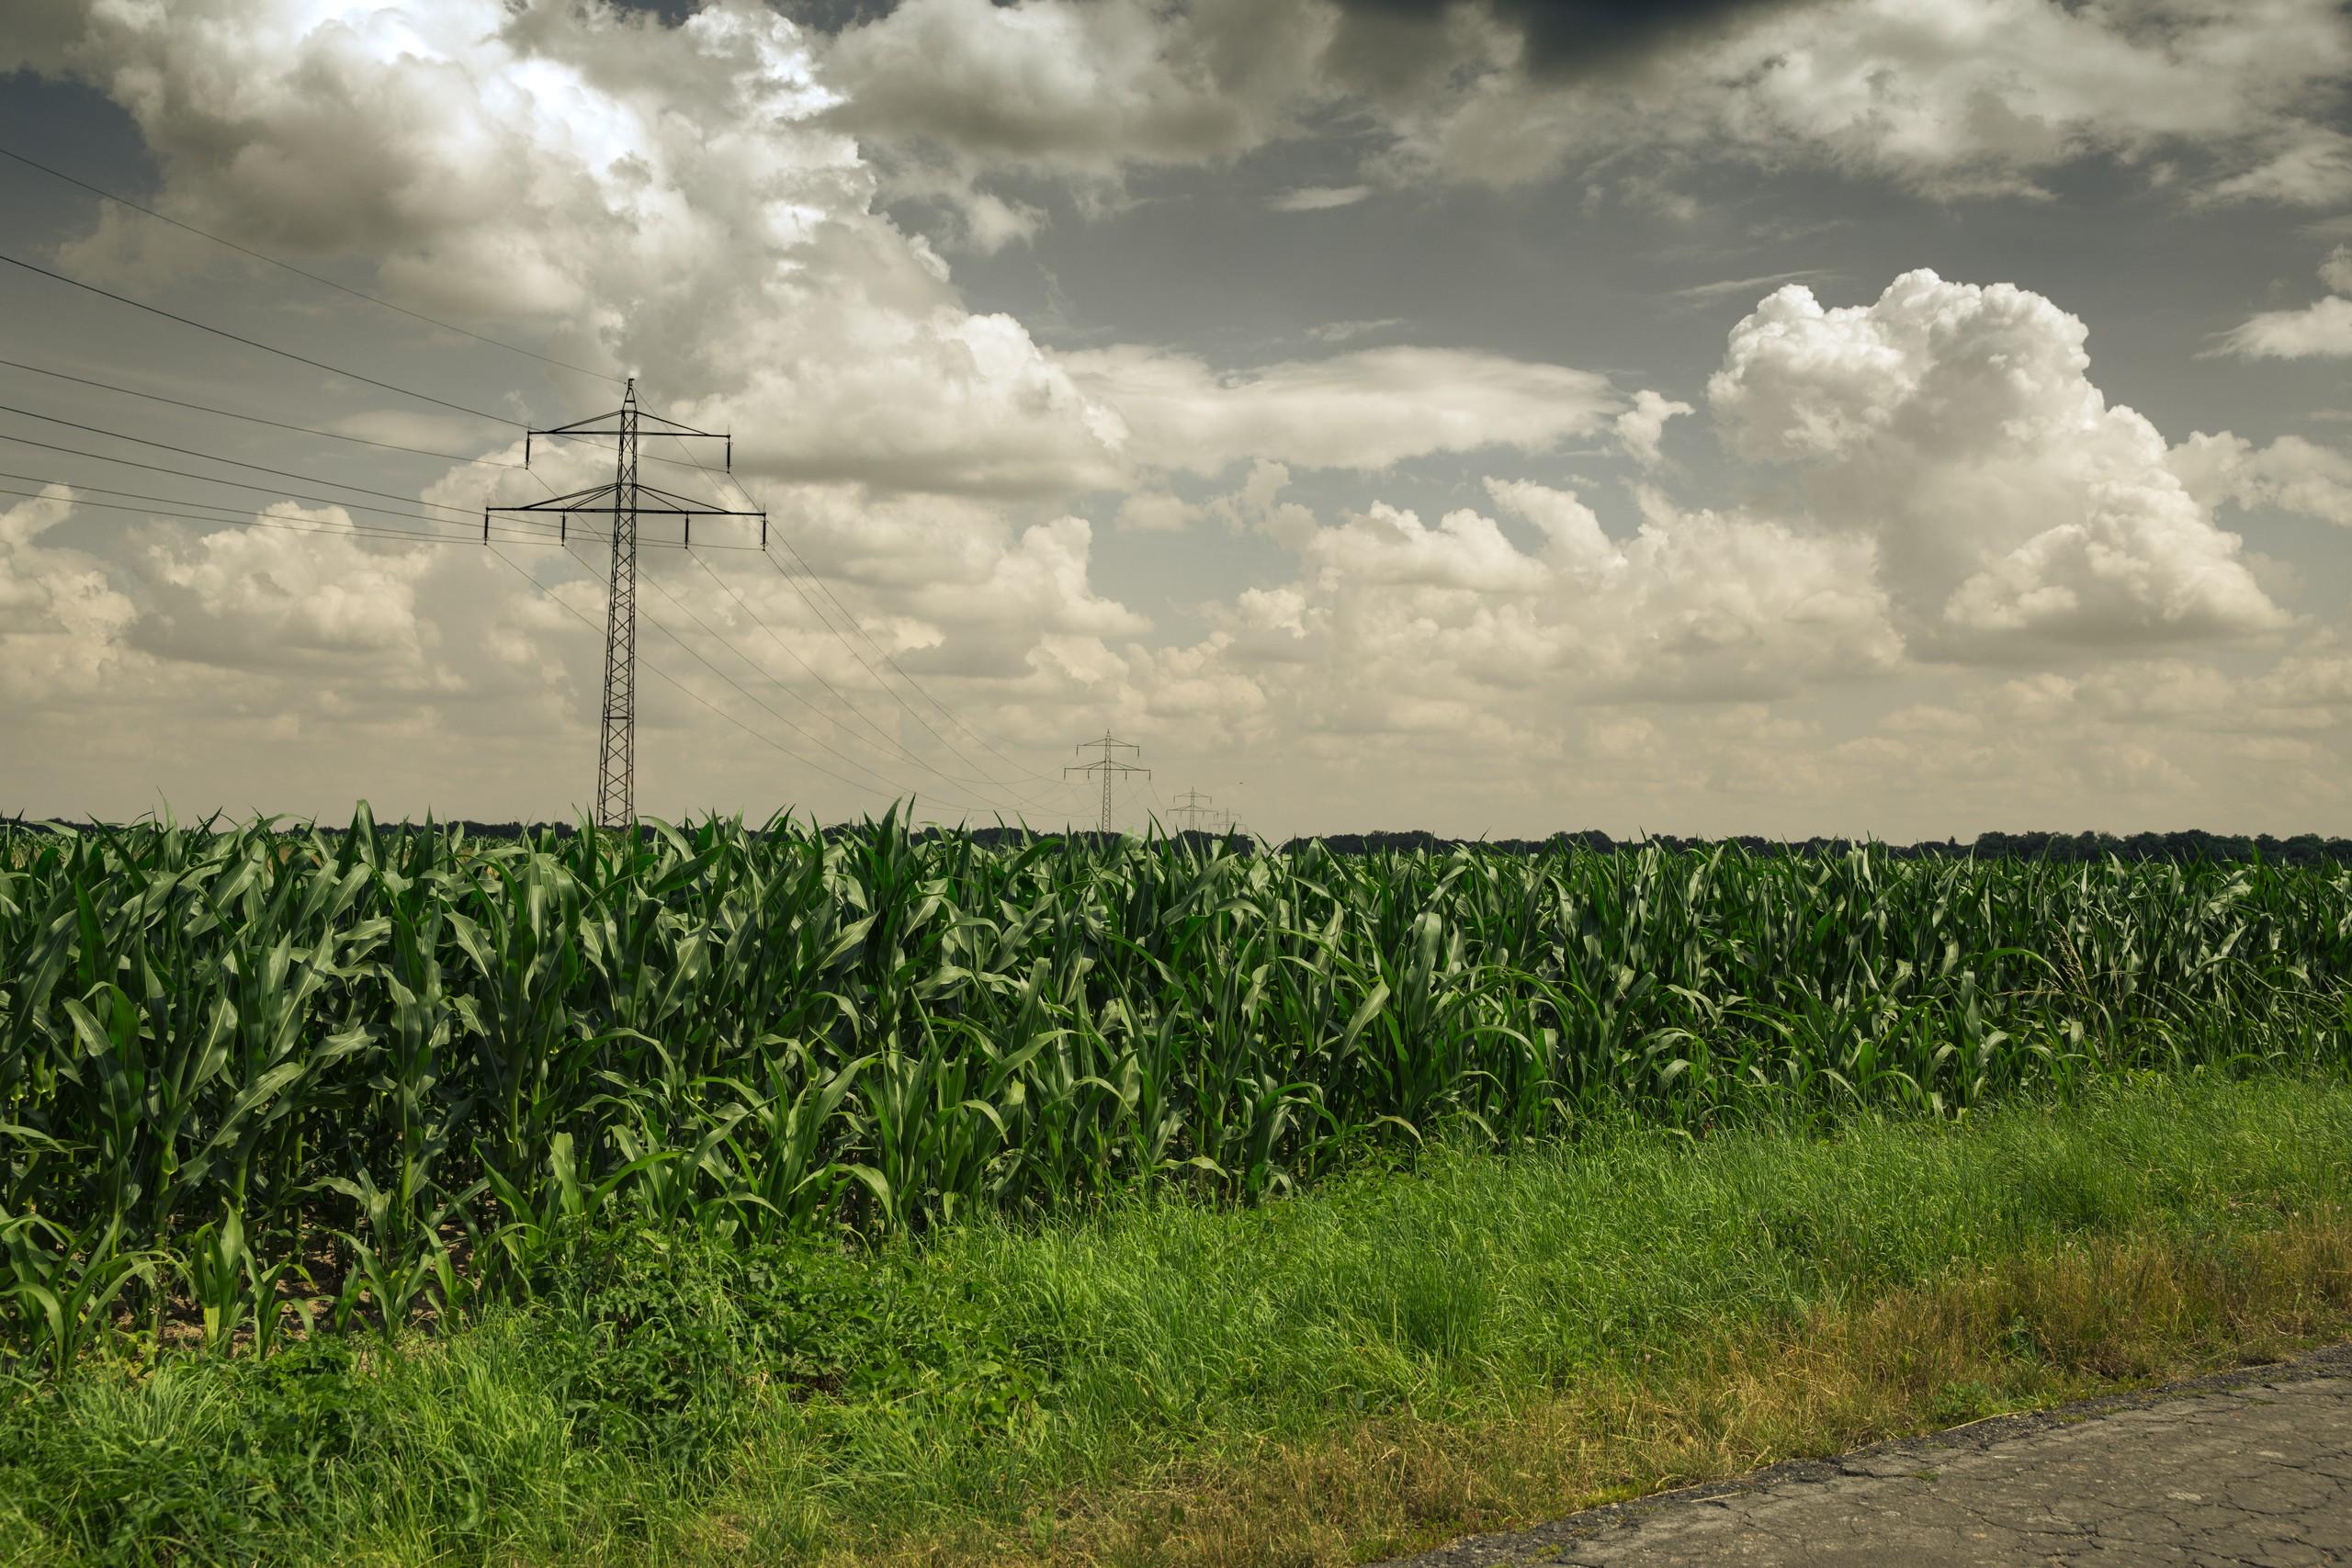
Topsoil Clay & Salinity Index
Gypsum and clay readings on bare soil. Salt itself is invisible to the sensor, so salinity is only ever inferred from what travels with it.
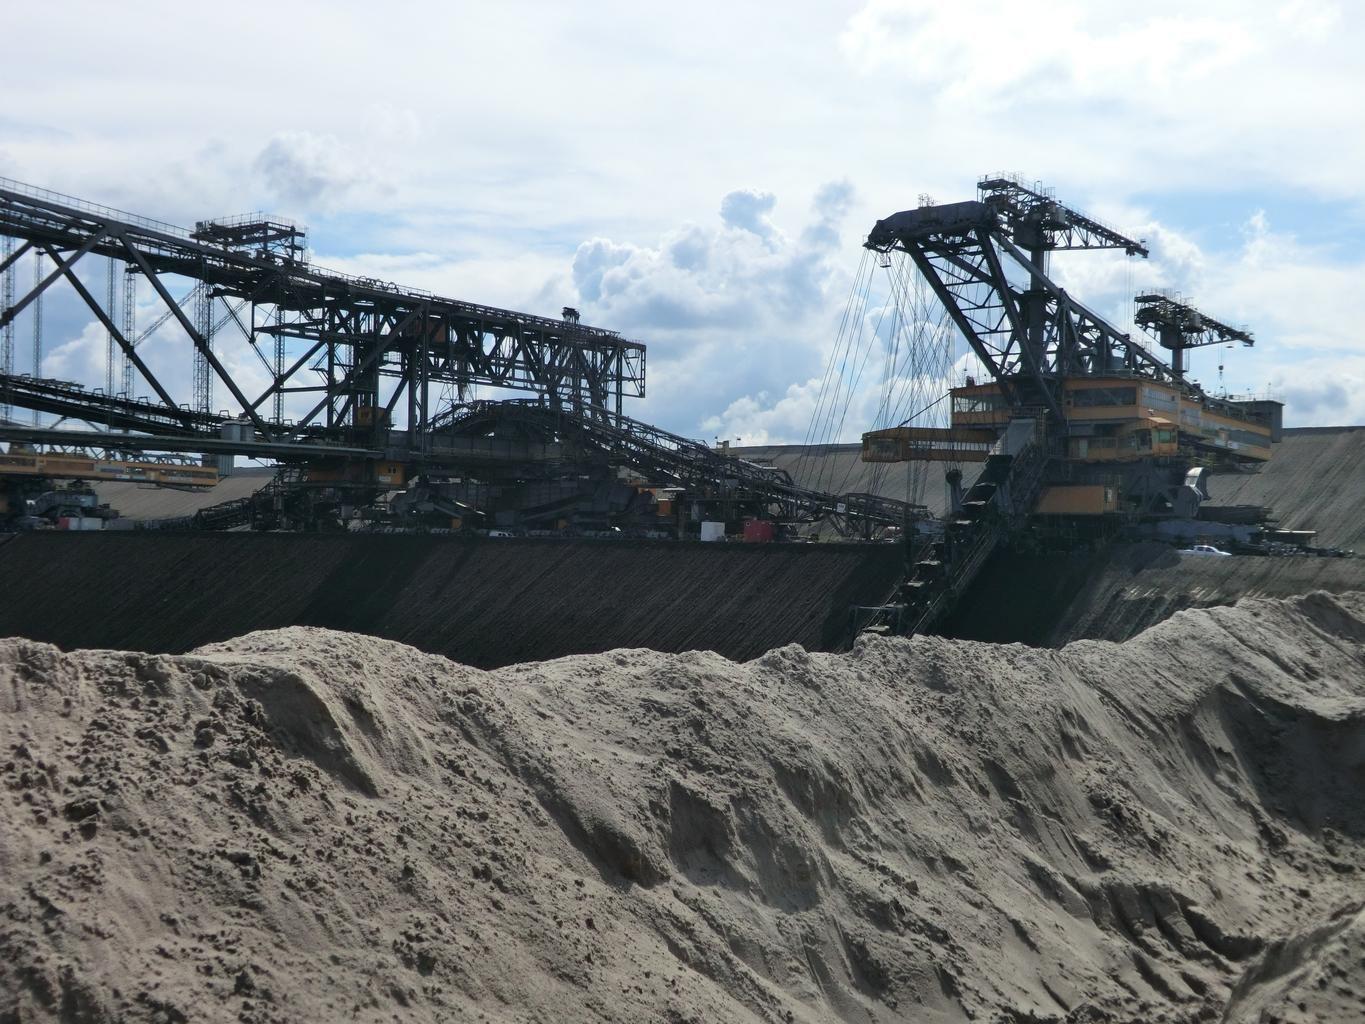
Mine Footprint & Disturbance
Multi-temporal surface disturbance, tailings boundaries and waste rock footprints, measured between dates.
Sub-Pixel Target Anomaly Detection
Anomaly detection against a locally estimated background, for man-made materials smaller than a pixel.
Infrastructure Thermal Inertia
Day and night thermal differencing, normalised by albedo. Dense material gives up heat more slowly than loose fill.